As the COVID-19 pandemic has spread and made its impact worldwide, air filtration has risen to prominence as a potential solution to the spread of viral contagions, as well as in addressing air pollution in general. In the United States, high-efficiency HVAC filters and RAPs (room air purifiers) are widely used for mitigating indoor particulate matters and combating the pandemic. However, some critical questions still need to be answered. How efficient are HVAC filters at capturing virus particles? How effective are HVAC filters and RAPs at reducing indoor particulate matters? What is the energy impact of high efficiency HVAC filters? Researchers from 3M, Emerson and LMS Technologies have recently collaborated in a series of scientific studies to answer these critical questions. Their research results will be published in series of articles in International Filtration News. The following article is Part I in this series. Find Part II in this series here. Find Part III in this series here.
SARS-CoV-2, also known as coronavirus, is known to transmit through droplets, contacts and aerosols. Droplets generated by coughing and sneezing can contain bacteria and virus, which cover a very wide particle size range (Lindsey et al. 2013).1 Small droplets can suspend in the air then dry to form fine particles which can stay in air for hours. In a recent research study2 (Guo et al. 2020), it was discovered that SARS-CoV-2 can be widely distributed in the air and on object surfaces. It was concluded from another study (Zhang et al. 2020)3, that airborne transmission, particularly via nascent aerosols from human atomization, is highly virulent and represents the dominant route for the transmission of this disease. In another study (Roy and Milton 2004)4, viable virus was detected in aerosols up to three hours post aerosolization. The World Health Organization (WHO 2020)5 recommended the use of airborne precautions whenever applicable in addition to standard, contact and droplet precautions. ASHRAE (American Society of Heating, Refrigerating and Air-conditioning Engineers) Epidemic Task Force (ASHRAE 2020)6 recently issued COVID-19 position statements, which indicate that transmission of SARS-CoV-2 through air is sufficiently likely that airborne exposure to the virus should be controlled.
The subject of removing bioaerosols by filters and other devices has been extensively studied by researchers in the past. Eninger et al. (2008)7 investigated the feasibility of a novel testing protocol that allows differentiating between the physical (total) and viable bioaerosol penetrations through respirator filters. They found that no statistically significant differences were observed between penetration values obtained for physical (total) and culturable viruses for the two control respirators. In another work (Liu et al. 2009)8, a test system was designed to determine the removal efficiencies of fibrous air filter media with traditional nonbiological airborne particles (Dioctylphthalate, polystyrene latex, etc.) and bioaerosols. It was found that efficiencies measured with the bioaerosols and nonbiological aerosols had similar characteristics, with the efficiency for the former generally found to be a little higher. The biological inactivation efficiency by HVAC in-duct ultraviolet (UV) light systems and filters was investigated in another study (Franke et al., 2006).9 It was found that the viral filtration efficiency and MERV rating had a similar trend, i.e., the higher the MERV, the higher the viral filtration efficiency. In other words, the filter efficiency measured with inert particles provided a fair indication on the filter performance against bioaerosols. In research (Peska and Lebkowska 2012)10 conducted to assess if application of non-biological aerosols reflects the air filters capacity to collect particles of biological origin, the collection efficiency for non-biological aerosol was tested with the PALAS set and ISO Fine Test Dust, while bioaerosols contained four bacterial strains of different shape and size: Micrococcus luteus, Micrococcus varians, Pseudomonas putida and Bacillus subtilis. It was found that non-biological aerosol containing particles of the same shape and surface characteristics (like DEHS spherical particles) did not give representative results for all particles present in the filtered air.
This study was carried out to investigate the efficacy and effectiveness of HVAC filters for removing viral particles in the airstream. In this study, we focused our investigation on viral filtration of residential HVAC filters. Residential HVAC filters of different filtration ratings, e.g., Filtrete MPR 300, 1500, 1550, 1900, 2200, 2500 and 2800, were investigated in this study.
Test method
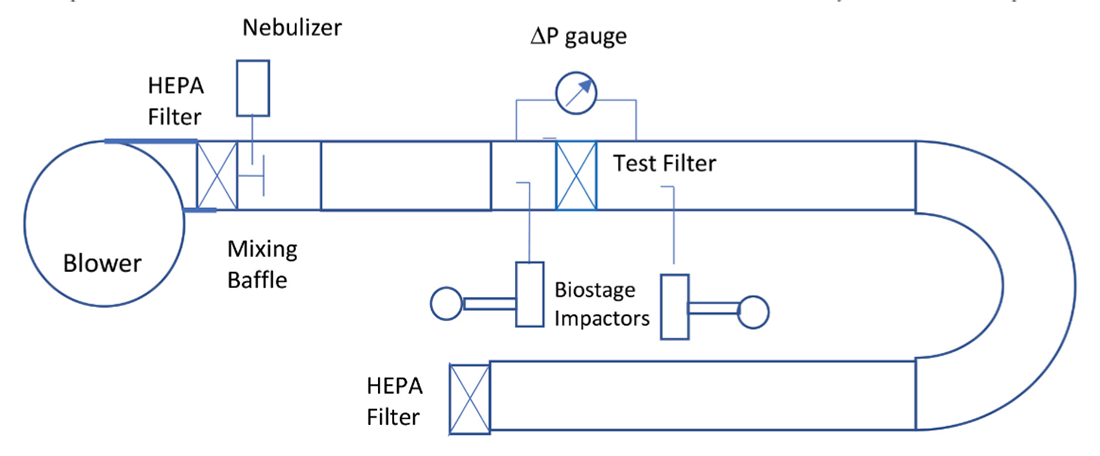
Figure 1 is a diagram of the test system. The single-pass viral filtration efficiency of residential HVAC filters was measured using a virus aerosol challenge, MS-2 bacteriophage, in a horizontal ASHRAE 52.2 (ASHRAE 2017)11 stainless-steel test duct. MS-2 is one of the four bioaerosols recommended by EPA (EPA 2006)12 for air filtration tests. MS-2 virus has approximately the same aerosol characteristics as a human virus and can serve as a surrogate for viruses of similar and larger size and shape. MS-2 virion (viral particle) is about 27 nm in diameter as determined by electron microscopy (Strauss et al. 1963)13, much smaller than the SARS-CoV-2 (COVID 19) virion, which measures about 120 nm in diameter (CDC 202014, Zhu et al. 202015). Another test method used for evaluating the inactivation efficacy of air cleaning device is ASHRAE 185.1, which is developed for testing UV-C lights devices in air-handling ducts for inactivation of airborne microorganisms. ASHRAE 185.1 employs Mycobacterium parafortuitum and Aspergillus sydowii as test microorganisms. In this study, MS-2 bacteriophage was used as the test microorganism because it is safe to use and has the relevant size and shape to viruses that have significant public health concerns, such as SARS-CoV-2 virus.
The tests were performed under positive pressure with a blower pushing air through a HEPA filter bank to provide particle-free air into the test duct airstream. MS-2 microorganisms were grown on appropriate media, harvested, and resuspended in saline to 5×10⁶ pfu/ml. Saline is commonly used in making bacterial suspension because the cells get acclimatized, and escape being ruptured by becoming turgid. Our experience showed that when using saline, specific size distribution of virus can be achieved repeatably. Suspension of the organisms was then aerosolized into the test duct using a nebulizer. Nebulizers have been widely used for generating bioaerosols. Nebulizer generators produce droplet aerosols with mass median aerodynamic diameters of 1 to 3 μm (National Research Council Committee on Animal Models for Testing Interventions Against Aerosolized Bioterrorism Agents, 2006).16 Mixing baffles designed per ASHRAE 52.2 were mounted in the downstream of the inlet HEPA filter. The MS-2 aerosol was introduced upstream of the mixing baffles. An 8 feet duct section was inserted between the mixing baffles and the sampling probe of the upstream SKC Biostage impactor to improve the mixing. The distance between the aerosol inject point and the upstream sampling probe was about 10 feet, allowing uniform mixing of the clean air and aerosol and complying with the AHSRAE 52.2 requirement for achieving adequate mixing.
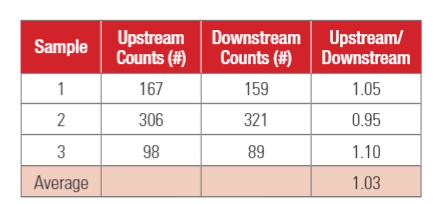
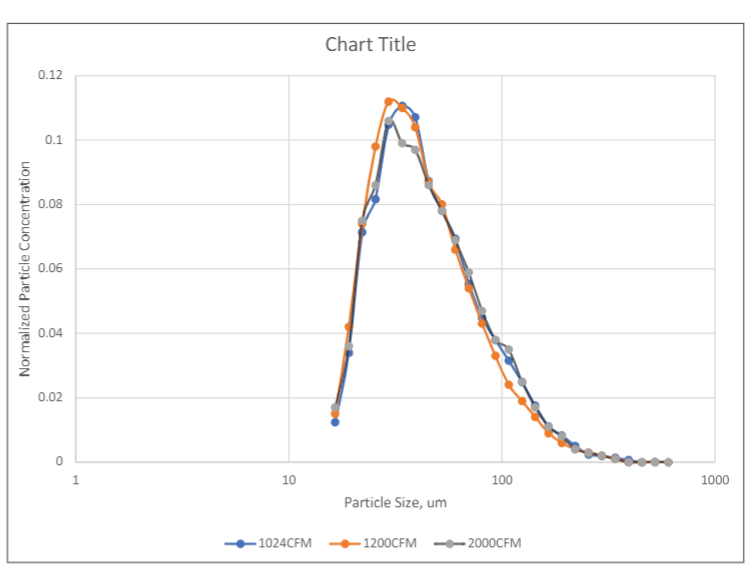
Figure 2 shows the particle size distributions of the MS-2 bacteriophage aerosol in the test duct measured using a TSI SMPS (Scanning Mobility Particle Sizer) model 3080 at three different duct airflow rates. As shown in Figure 2, particle size distributions measured at three different flowrates had similar distributions, indicating the stability of the MS-2 aerosol in the test duct at different residence times, i.e., 1.3 seconds at 2000 CFM and 2.5 seconds at 1024 CFM. It is also noticed that the peaks of the distributions are between 30 nm and 60 nm, larger than the MS-2 virion size of 27nm, indicating that some droplets contained multiple virions. The sampling point of the SMPS was at the same plane as the upstream sampling probe of the SKC Biostage impactor. For each filter test, three upstream air samples and three downstream air samples were taken using SKC BioStage cascade impactors for 5-minutes at calibrated sampling rates of 28 liters/min. The BioStage impactor was the sixth stage of the Andersen six-stage sampler that had a cutoff size of 0.65 µm. Although the cutoff size of the impactor was larger than the peak size of the MS-2 aerosol, a portion of the MS-2 aerosol had particles larger than the cutoff size of the impactor and were collected by the impactor.
The collection plates, having a double layer agar consisting of a hard LB (Lysogeny Broth) bottom layer and a soft top layer incorporating E. Coli, were then incubated at 35 C and 96% RH for 24-hours. After incubation, the recovered plaque-forming units (PFU) were enumerated. Only PFUs of size 1.0mm or larger were counted.
Since viability of microorganisms in the test duct may affect the test results, the upstream PFUs and downstream PFUs of the empty test duct were measured and compared. The results are shown in Table 1. As shown in Table 1, although there was significant fluctuation in the upstream and downstream PFUs, the ratio of the upstream PFUs to the downstream PFUs remained relatively close together, indicating good viability of MS-2 bacteriophage in the test duct.
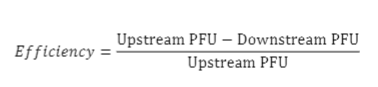
The efficiency was then calculated using the formula.
Filter information
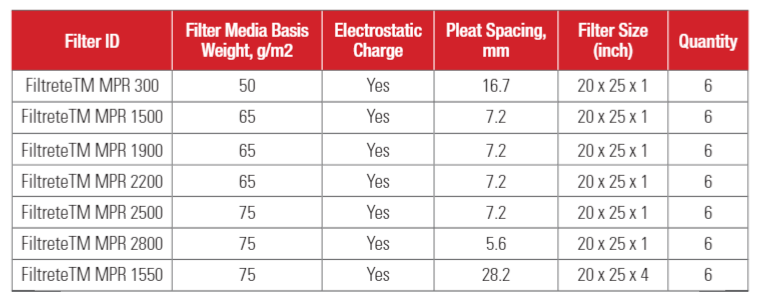
Seven types of residential HVAC filters were investigated in this study. Our intention was to focus this study on high efficiency filters, i.e., MPR 1500 (or MERV 12) and higher efficiency HVAC filters. We selected these filters because they are high efficiency HVAC filters that are commonly used in residential homes. MPR 300 (or MERV 5) filter was selected as a comparative filter for this study. All filters were made with electrostatically charged filter media. Filter information is shown in Table 2.
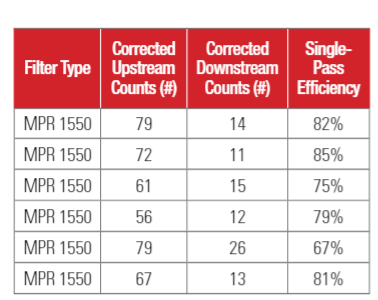
Testing was conducted at 22 C and 50% relative humidity. The flowrate of the air passing through the filter was set at 1024 CFM (1740 m3/hour) for MPR 300, MPR 1500, MPR 1900, MPR 2200, MPR 2500 and MPR 2800 filters, resulting in a face velocity of 295 FPM (1.5 m/s). MPR 1550 filters, which have pleat depth of 4 inches, were tested at 1707 CFM (2902 m3/hour), or a face velocity of 492 (2.5 m/s). Six samples of each filter type were tested one by one in a random order.
Test results
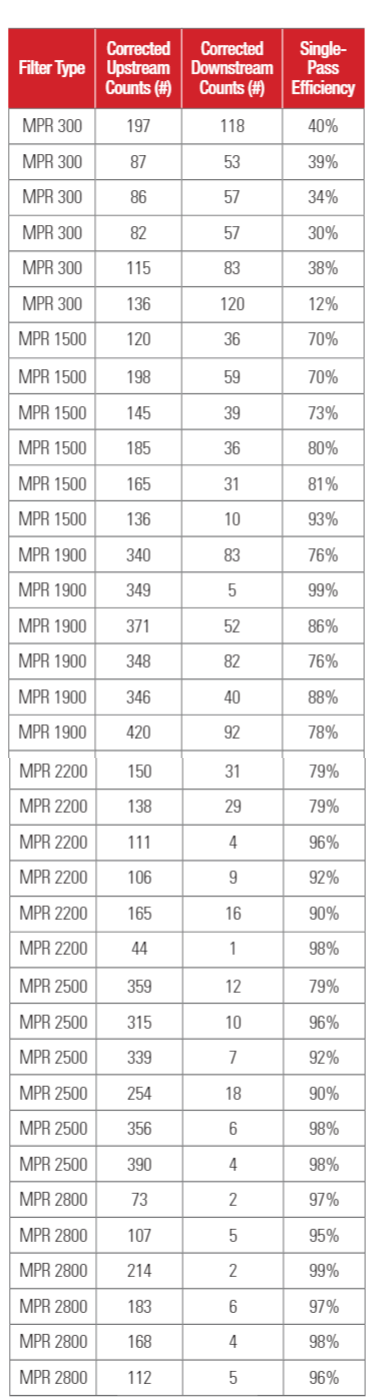
Test results for 1-inch depth (20x25x1) filters are shown in Table 3a. Test results for 4-inch depth (20 x 25 x 4) filter are shown in Table 3b. The upstream PFU counts and downstream PFU counts shown in Table 3 were adjusted for hole corrections (Macher 1989)17. The upstream counts and downstream counts given in Table 3 are the averages of three air samples.
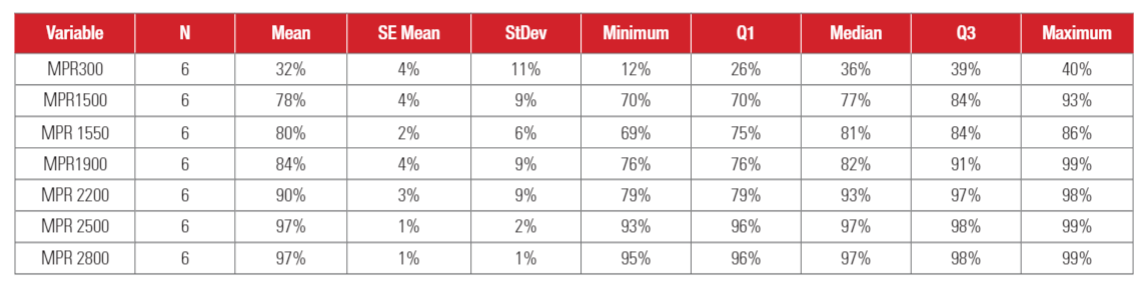
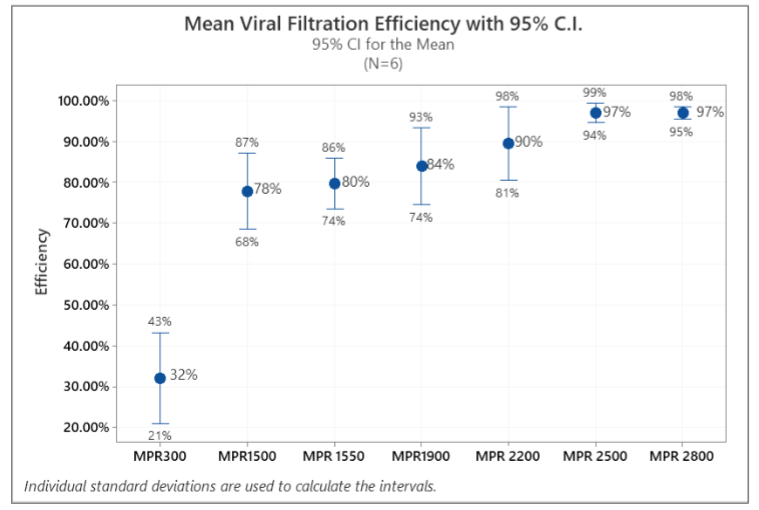
Statistical analysis results for VFE (Viral Filtration Efficiency) are shown in Table 4. As shown in Table 4, standard deviations of VFE are relatively wide, which can be attributed to the variability in the bioaerosol sampling, as well as relatively small sample size (N=6). It is also interesting to see that the standard deviation decreases with the increasing MPR rating, indicating that results are more repeatable for higher MPR filters. The mean efficiency and median efficiency values were close to each other, indicating the test data was relatively symmetrically distributed.
Figure 3 shows the mean and 95% confidence interval of VFEs for all filters. As shown in Figure 3, MPR 300 through MPR 2200 filters had a relatively widespread in efficiency data, which can also be attributed the same reasons discussed above.
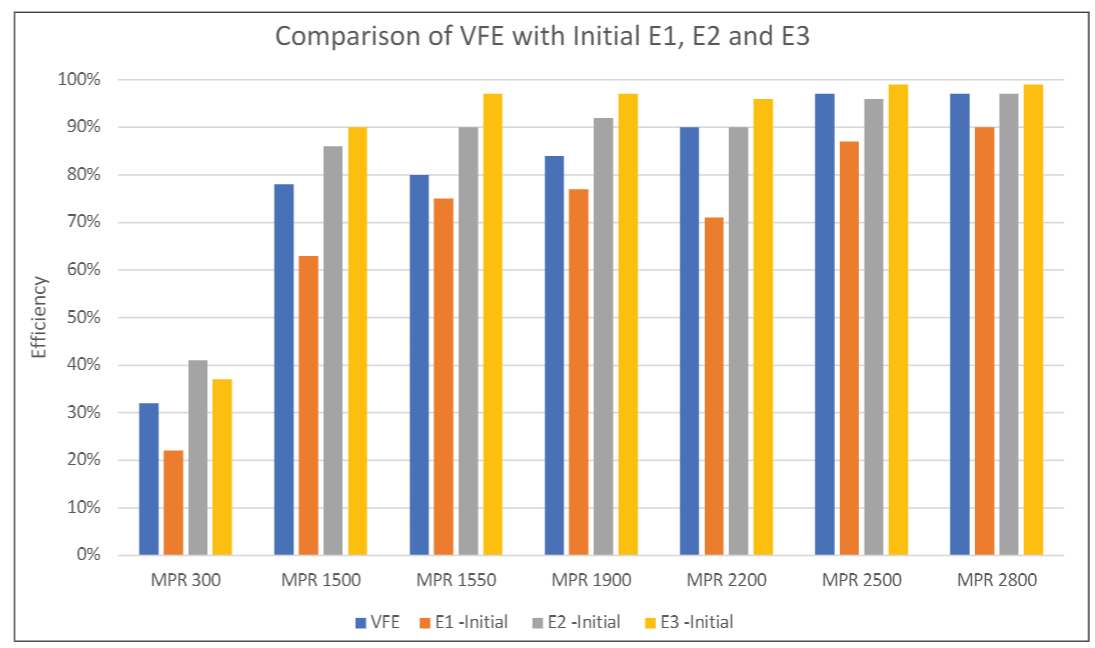
E1 (0.3 µm – 1.0 µm), E2 (1.0 µm – 3.0 µm) and E3 (3.0 µm – 10 µm) efficiencies defined according to ASHRAE 52.2 are commonly used in residential and commercial HVAC applications. People in the HVAC industry are familiar with E1, E2 and E3 efficiencies, while VFE is usually not reported for HVAC filters. It would be beneficial for filter users to know the relative relationship between VFE and E1, E2 or E3. Although MS-2 virion is much smaller than KCl particles, the challenge aerosol used in ASHRAE 52.2, the MS-2 bacteriophage aerosol contained particles larger than MS-2 virions and particles collected by the BioStage impactor were greater than 0.65 µm. Therefore, the comparison of VFE versus E1, E2 or E3 should be relevant. Figure 4 shows the comparison of the viral filtration efficiency versus the E1, E2 and E3 efficiencies of clean filters measured per ASHRAE 52.2. As shown in Figure 4, the VFE is always higher than E1 but lower than E2 or E3 efficiencies. In other words, E1 efficiency can provide a conservative estimate for the viral filtration performance of a filter, also indicating that viral particles collected on sampling plates were likely to be in the size range of 0.3 µm to 3 µm, i.e., the lower size limit of E1 and upper size limit of E2. It should be noted here that the stability of the aerosol size distribution can have significant impact on the VFE measurement. Therefore, it is important to ensure the stability of the aerosol in the testing (Figure 2).
Summary
An experimental study was carried out to investigate effectiveness of residential HVAC filters at removing airborne virus particles. MS-2 bacteriophage organisms were grown on appropriate media, harvested, resuspended in saline, and then aerosolized into the ASHRAE 52.2 test duct using a nebulizer. Upstream and downstream air samples were taken using SKC BioStage cascade impactors. The collection plates were incubated, and the recovered plaque-forming units (PFU) were enumerated to determine the filtration efficiency of filters against virus particles. The following conclusions can be drawn from this study.
(1) High efficiency residential HVAC filters were found to be effective at capturing airborne virus particles.
(2) Filter viral filtration efficiency was found to be generally correlated to its MPR rating, i.e., the higher the MPR rating, the higher the viral filtration efficiency.
(3) In comparison to E1, E2 and E3 efficiencies measured per ASHRAE 52.2, VFE was found to be higher than initial E1 efficiency, but lower than initial E2 and E3 efficiencies.
References
- Lindsley WG, Reynolds JS, Szalajda JV, Noti JD, Beezhold DH (2013), “A Cough Aerosol Simulator for the Study of Disease Transmission by Human Cough-Generated Aerosols,” Aerosol Sci Technol, 2013;47(8):937‐944. doi:10.1080/02786826.2013.803019.
- Zhen-Dong Guo, Zhong-Yi Wang, Shou-Feng Zhang, Xiao Li, Lin Li, Chao Li, Yan Cui, Rui-Bin Fu, Yun-Zhu Dong, Xiang-Yang Chi, Meng-Yao Zhang, Kun Liu, Cheng Cao, Bin Liu, Ke Zhang, Yu-Wei Gao, Bing Lu, and Wei Chen (2020), “Aerosol and Surface Distribution of Severe Acute Respiratory Syndrome Coronavirus 2 in Hospital Wards, Wuhan, China,” 2020, Emerging Infectious Diseases, Vol 26, early release, ISSN: 1080-6059.
- Renyi Zhang, Yixin Li, Annie L. Zhang, Yuan Wang, Mario J. Molina (2020) “Identifying airborne transmission as the dominant route for the spread of COVID-1,” Proceedings of the National Academy of Sciences, June 2020, 202009637; DOI: 10.1073/pnas.2009637117.
- Roy C.J., Milton DK. (2004), “Airborne transmission of communicable infection—the elusive pathway”. N Engl J Med 2004; 350:1710–1712.
- “Infection prevention and control during health care when novel coronavirus (nCoV) infection is suspected,” 2020, World Health Organization, https://www.who.int/publications-detail/infection-prevention-and-control-duringhealth-care-when-novel-coronavirus-(ncov)-infection-is-suspected-20200125.
- ASHRAE Position Document on Infectious Aerosols, approved by ASHRAE Board of Directors, April 14, 2020. https://www.ashrae.org/file%20library/about/position%20documents/pd_infectiousaerosols_2020.pdf.
- Robert M. Eninger, Atin Adhikari, Tiina Reponen, Sergey A. Grinshpun, 2008, “Differentiating Between Physical and Viable Penetrations When Challenging Respirator Filters with Bioaerosols,” Clean Soil Air Water, Volume 36, Issue 7, “Special Issue: Bioaerosol Research,” July 2008, Pages 615-621.
- Junjie Liu, Ruiying Qi, Quanpeng Li, Guiyuan Han & Jiancheng Qi, 2009, “Filtration of Bioaerosols Using Fibrous Air Filter Media,” HVAC&R Research, 15:6, 1165-1174.
- Franke, D.L., A.R. Trenholm and M. Kosusko, 2006, “Verification of Testing of Technologies to Clean or Filter Ventilation Air,” In Proceedings, Indoor Environmental Quality: Problems, Research and Solutions, Durham, NC, July 17 – 19, 2006. Air & Waste Management Association, Pittsburgh, PA, 8 p., 2006.
- Ewa Miaskiewicz-Peska and Maria Lebkowska, 2012, Comparison of aerosol and bioaerosol collection on air filters, Aerobiologia (Bologna). 2012 Jun; 28(2): 185–193.
- ASHRAE Standard 52.2-2017 (2017), Method of Testing General Ventilation Air-Cleaning Devices for Removal Efficiency by Particle Size. American Society of Heating, Refrigerating and Air-Conditioning Engineers. Atlanta, GA.
- EPA Achieve Document, 2006, “Generic Verification Protocol for Biological and Aerosol Testing of General Ventilation Air Cleaners,” EPA Cooperative Agreement R-83191101
- Strauss JH, Sinsheimer RL, 1963. “Purification and properties of bacteriophage MS2 and of its ribonucleic acid,” Journal of Molecular Biology, 7: 43–54. doi:10.1016/S0022-2836(63)80017-0. PMID 13978804.
- U.S. CDC: Coronaviruses: https://www.cdc.gov/coronavirus/types.html (Updated February 15, 2020) [Accessed April 01, 2020].
- Na Zhu, Ph.D., Dingyu Zhang, M.D., Wenling Wang, Ph.D., Xingwang Li, M.D., Bo Yang, M.S., Jingdong Song, Ph.D., Xiang Zhao, Ph.D., Baoying Huang, Ph.D., Weifeng Shi, Ph.D., Roujian Lu, M.D., Peihua Niu, Ph.D., Faxian Zhan, Ph.D., Xuejun Ma, Ph.D., Dayan Wang, Ph.D., Wenbo Xu, M.D., Guizhen Wu, M.D., George F. Gao, D.Phil., and Wenjie Tan, M.D., Ph.D. (2020), A Novel Coronavirus from Patients with Pneumonia in China, 2019, New England Journal of Medicine, 382(8), 727-733. doi: 10.1056/NEJMoa2001017
- National Research Council (US) Committee on Animal Models for Testing Interventions Against Aerosolized Bioterrorism Agents. Overcoming Challenges to Develop Countermeasures Against Aerosolized Bioterrorism Agents: Appropriate Use of Animal Models. Washington (DC): National Academies Press (US); 2006, 3, Generation and Characterization of Aerosolized Agents. Available from: https://www.ncbi.nlm.nih.gov/books/NBK20351/.
- Janet M. Macher (1989), “Positive Hole Corrections of Multi-Jet Impactors for Collecting Viable Microorganisms,” Am. Ind. Hyg. Assoc. J. 50(11): 561-568 (1989).


