Cake washing normally is used to flush out impurities from a formed cake that contains soluble impurities.1 The voids of the filter cake are normally filled by the purer liquid during the cake washing process. Many examples of industrial cake washing applications are practiced, but the key ones are generally for pigments and dyestuffs, agricultural chemicals, pharmaceuticals, beverage processing, etc.
Generally, washing is done to remove impurities from a valuable solid product1, but it can also be used to flush out a valuable liquid product from a waste solid product. Cake washing has been practiced in a variety of devices from vacuum drums and belt filters2, to basket centrifuges and candle filters3, to rotary pressure filters4, to automatic pressure filters5, and to filter presses (including all three types: plate and frame, recessed chamber, and membrane recessed chamber6-8). Significant work has been done on modeling1, as well as on the non-ideal aspects of the cake washing process9. Even laboratory devices have been developed to simulate the cake washing process.8
The preferred way to describe the washing process is by use of the so-called washing curve or plot, where the normalized impurity concentration in the cake is related to the Wash Ratio (or the number of wash displacements, N) as defined by the volume of wash liquid used divided by the volume of liquid in the cake at the start of the washing process.1 Unfortunately, many investigators simply plot the solute concentration versus washing time which can be misleading. As discussed in Ref. 1, it is very important to measure the impurity concentration in the cake along with the exiting impurity concentration in the wash liquid. The reason is that the porous solid particles form a non-ideal cake, which can lead to cake non-uniformities that may not be detected by impurity measurements in the wash. In addition, an impurity mass balance must be done around the washing process. Nevertheless, there are four ways to represent this wash curve1, but all four are related to the Wash Ratio. Perhaps the most important of these is the percentage of impurity remaining in the cake plotted against the Wash Ratio, because only then can non-ideal washing be ascertained as postulated in Ref. 1.
As discussed above, there are many SLS devices where cake washing can be accomplished, but the membrane recessed chamber filter press is among the most efficient6-8 in terms of both impurity removal and wash consumption. As discussed in Ref. 1, there are basically three wash regions: (1) direct displacement of mother liquor; (2) mass transfer diffusion; and (3) an intermediate region where some cake pores undergo displacement while others undergo mass transfer diffusion. It is precisely in these intermediate and diffusion regions where the membrane filter press is appropriate because long wash times can be tolerated, cake consolidation can be accomplished to avoid cake shrinkage and wash bypassing (or short-circuiting), and large tonnages can be produced. Of course, this situation is usually confined to the washing of fine particles.
Another key point in cake washing is the non-ideal effect associated with non-uniform wash distribution near the filter cloth surface.9 This maldistribution is caused by the cloth support used for mechanical integrity, which vary significantly from device-to-device as well as within the same membrane filter press category, for example. Many different types of membrane filter plates can be used, and all of these affect this non-uniform wash distribution differently. This paper will discuss membrane filter press cake washing and how some plate designs can affect washing results.
Preliminary washing data
Before any wash study is conducted, all preliminary calibrations must be done to assure reliable wash plots.8 For example, Figure 1 presents the % Dissolved Salts plot versus conductivity for the titanium dioxide (Ti02) cake washing studied here. Note that three meters were used here (two Myron L and one Beckman conductivity bridge) to avoid instrument errors; and all meters were calibrated weekly with purchased calibration standards.
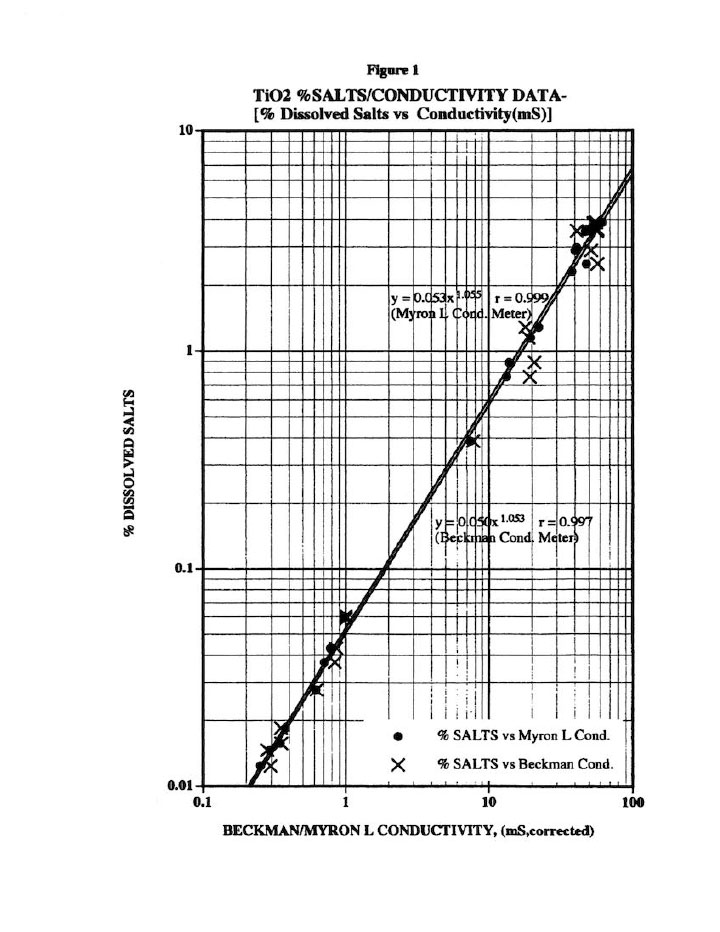
Figure 2 presents the typical Total Suspended Solids (TSS) versus Turbidity plot used to correct for the solids that escape from the membrane press into the various exit streams.
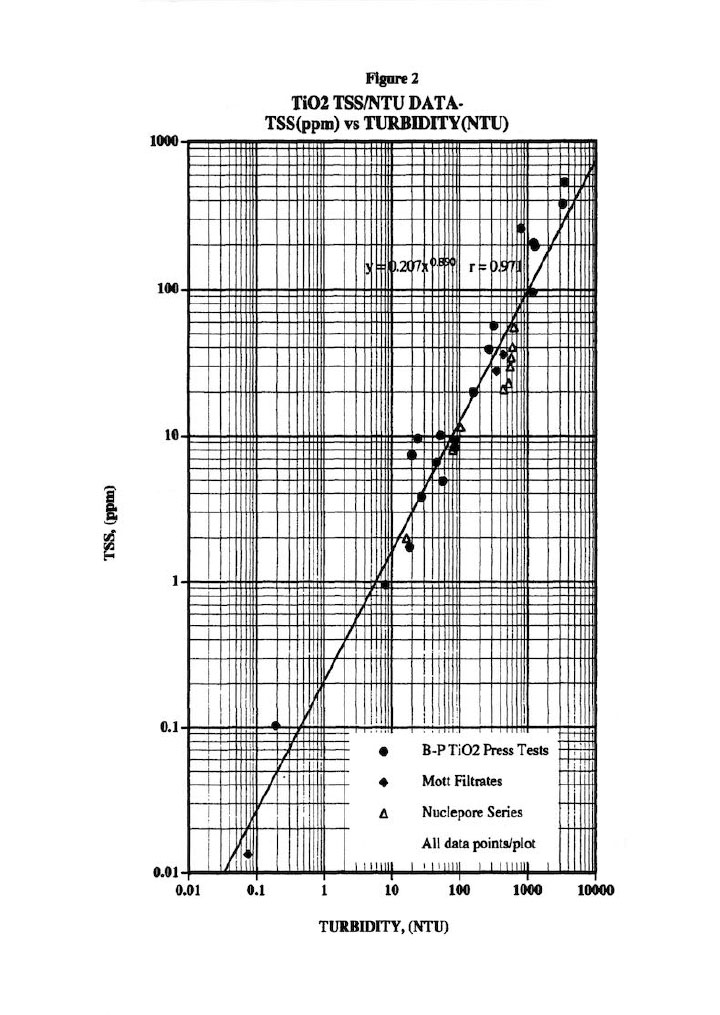
Figure 3 presents a typical cake solids leaching plot used to assess the amount of salt (impurity) remaining in the cake.8 Note that the plant result (done on wet cake with an assumed cake % solids measured on another piece) results in approximately 45 days leaching of dried cake, which can be accurately measured. As a result, this 45 day leaching value was used for all tests. Furthermore, all results here are average of 9 values for two distinct cakes (or 18 values), which necessarily produces highly accurate results (i.e., note the excellent R=1.0 correlation coefficient for the Test #2 results). In addition, the nine samples per cake enabled us to check washing variability within a cake at various locations (particularly since wash water is only introduced at one point into the plate recess).
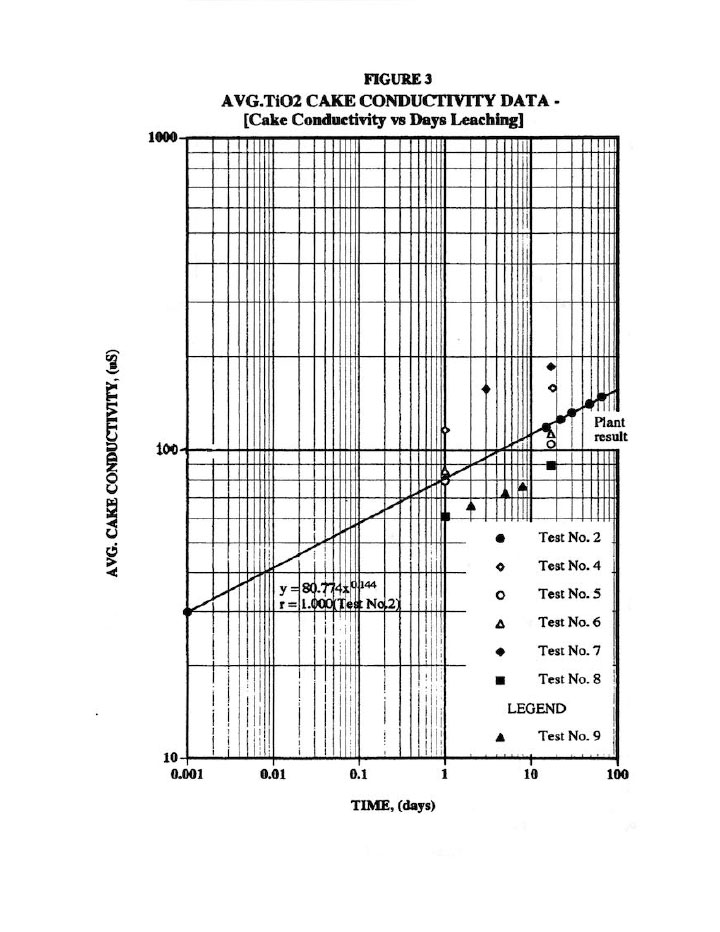
These three plots along with the cake weight, filtrate and wash properties enabled us to perform a complete salt material balance on each test; and thus, to determine N and to calculate the amount of salt removed from the cake as well as the amount left in the cake.
Typical wash plots
Figure 4 presents typical wash plots used by many industrialists where the outlet wash conductivity is measured against wash time. This sort of plot can be quite misleading since it doesn’t account for the wash rate nor the amount of salt remaining in the cake. The plots in Figure 4 do, however, suggest that extra-ported plates may improve washing; and in fact, a later fluid-flow analysis revealed significant pressure drop across the outlet wash drainage holes. As a result, the membrane plates were specified with an extra four holes to improve washing; and plant data revealed almost 10 years ago that this was the case. Similarly, the plots seem to suggest that reverse-ported washing (i.e., washing in opposite direction from the normal way) does not offer any benefits. In addition, the old-style grooved plates (as opposed to the standard pips6, 7), as well as the old-style extra-ported Klinkau plates suggest superior washing.
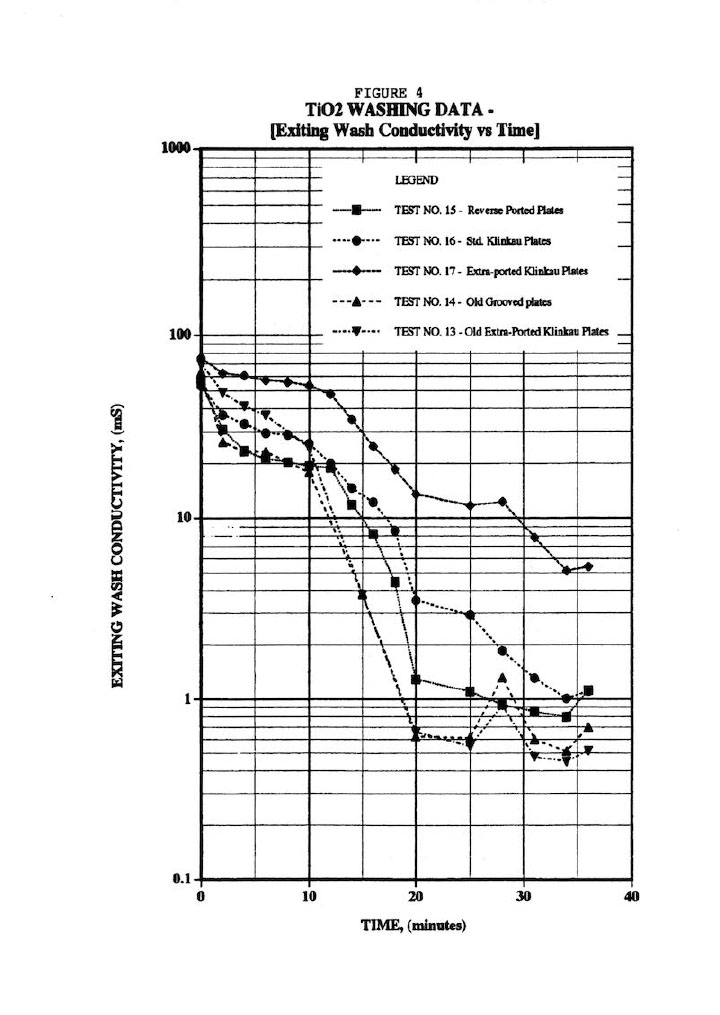
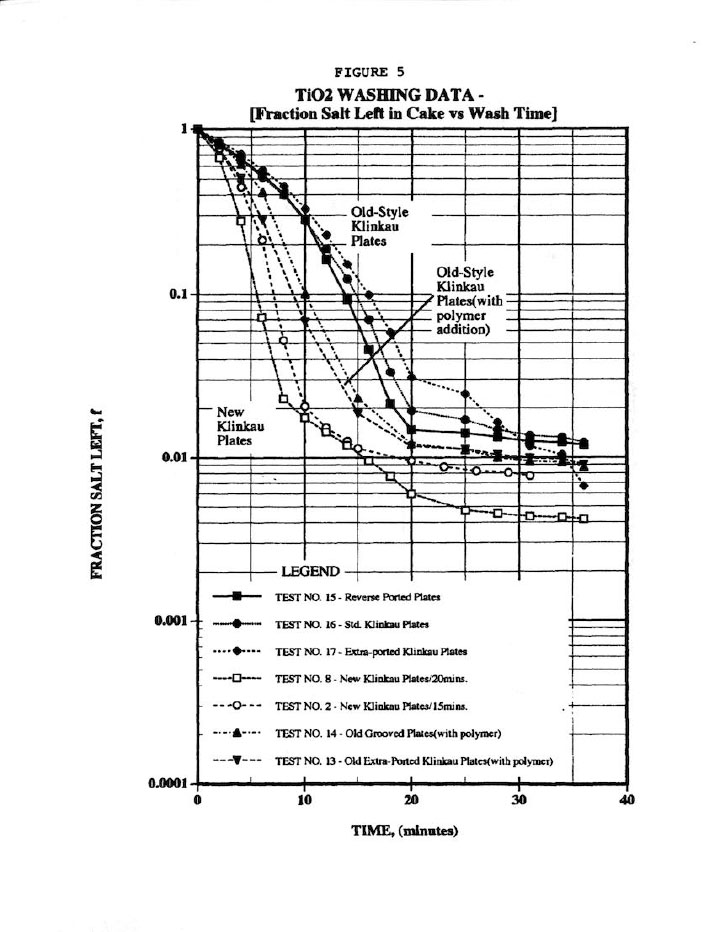
Figure 5 compares the wash plots to the new Klinkau plates used here versus the 10-year-old style plates, and indicates superior washing (i.e., similar fraction salt left in cake, f, in about onehalf the time). Again, Figure 5 is a typical wash plot used by industrialists to determine wash cycle times, but at least it used the more valid parameter, f. In addition, Figure 5 shows that polymer addition improves washing, but then the extra polymer cost was not warranted here due to its high cost.
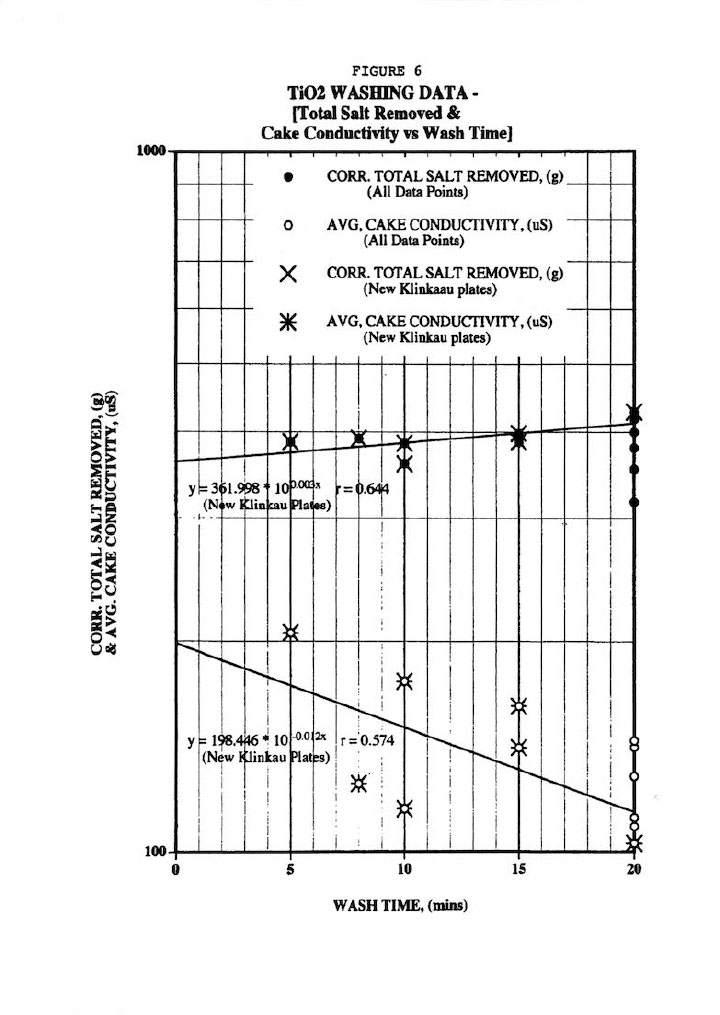
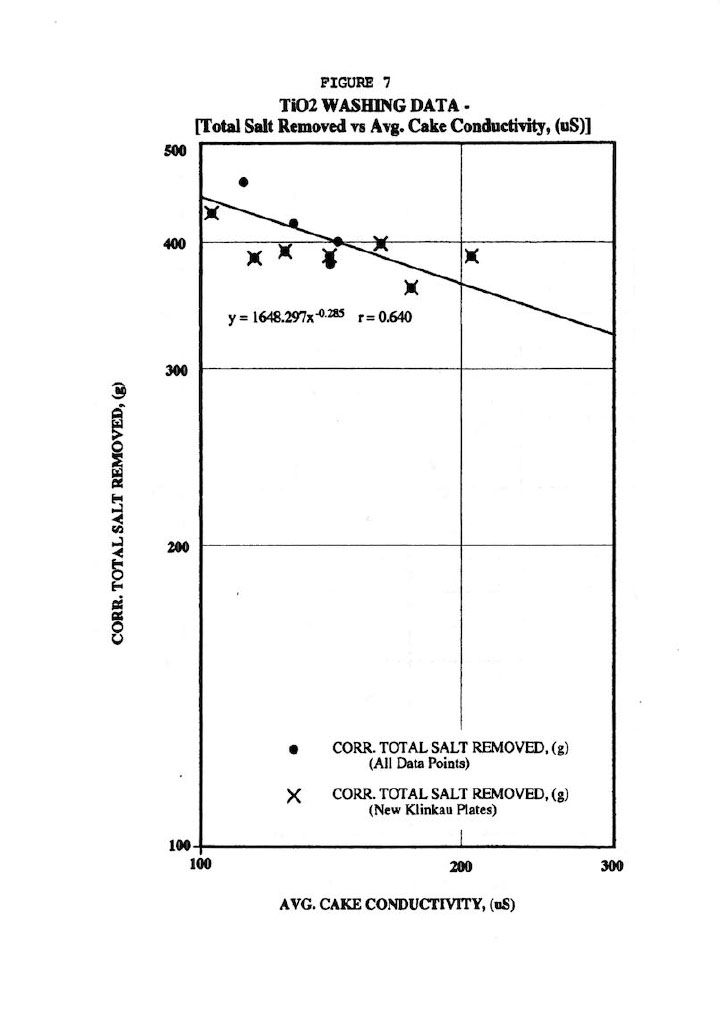
Finally, Figure 6 shows fair correlations of the total salt removed (r=0.644) and residual salt in cake (as measured by cake conductivity r=0.574) with wash time, but scatter is quite evident particularly the data from the old-style Klinkau plates. Note that all total salt removal data was corrected for the cake amount since thicker cakes obviously contain more salt than thinner ones. This also points out the fallacy of strictly using wash time as the independent variable. Similarly, Figure 7 shows a fair correlation (r=0.640) of total salt removed versus residual salt in washed cake (as measured by the average of the 18 cake conductivity values after 45 days leaching).
Actual wash plots
Figure 8 shows a fairly good (r2 = 0.706) linear correlation of the average cake conductivity (18 determinations) versus f, the fraction of salt left in the cake as determined from the overall material balances across the membrane filter press operation, (even for the old-style Klinkau plates). This plot validates the assertion in Ref. 1 that an impurity mass balance must be done around the washing process to confirm any non-ideal washing effects. It should also be pointed out that the offset data point in Figure 8 (162 uS cake conductivity at f=0.0056) was obtained from a different feed slurry compared to the other data points (and which showed a much larger particle size distribution). This illustrates the importance of wash experiments being conducted on the same batch of slurry; and of course, the variability that is typically found in any industrial process.
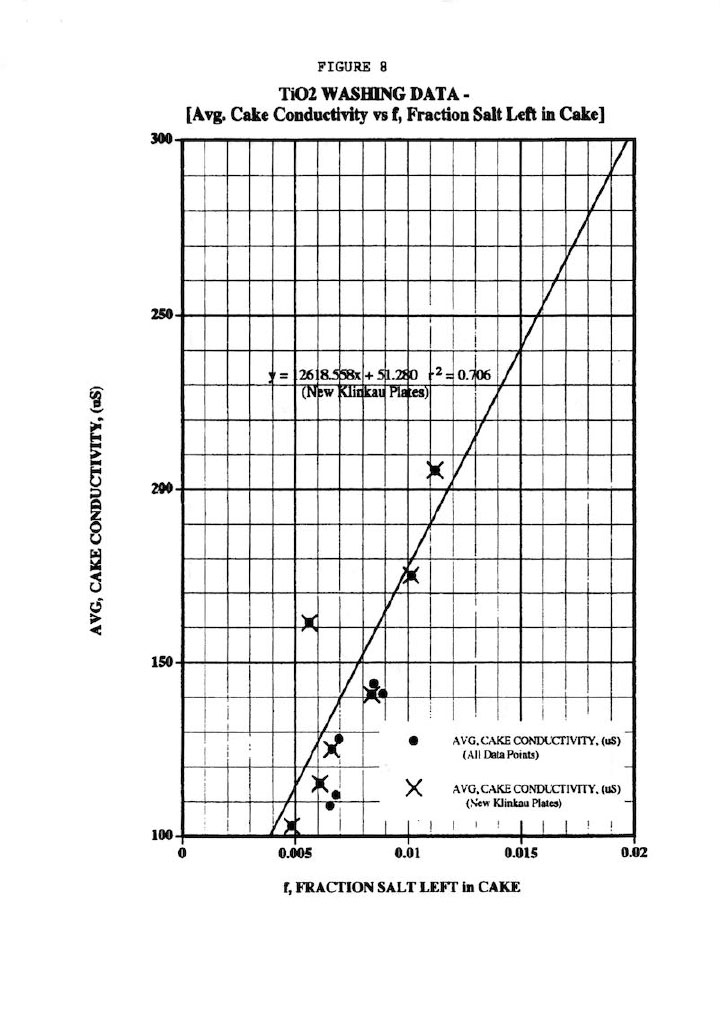
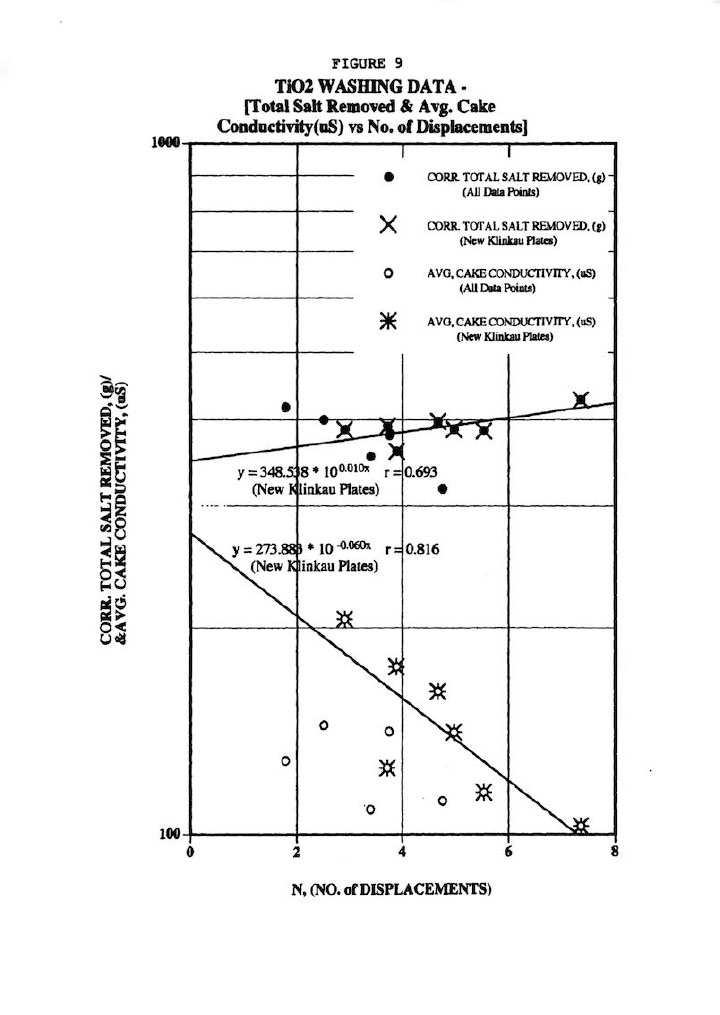
Figure 9 illustrates a typical wash plot of total salt removed and average cake conductivity (or residual salt in cake) versus the actual measured number of displacements, N. These correlations are quite good considering the difficulties in obtaining accurate material balances, particularly the total salt removed values.
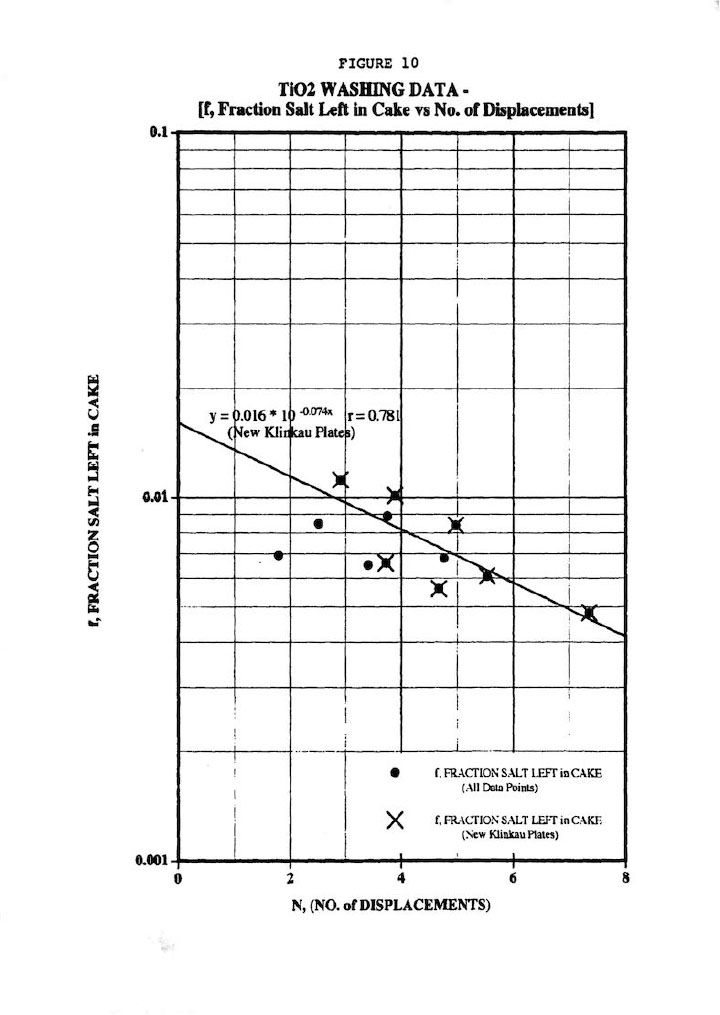
Finally, Figure 10 shows the most important wash plot of f (fraction salt left in cake) versus N (No. of displacements, or Wash Ratio), which is of prime importance for pigment cake washing. Figure 10 demonstrates a good (r=0.781) correlation of all the data regardless of plate type, but certainly a better correlation for the new Klinkau plates. This plot also indicates that the new Klinkau plates produce superior washing results particularly at larger N values, or conversely result in higher N at equivalent wash times (i.e., refer to Figure 5). In other words, the new Klinkau plates result in faster wash times, which directly translate into increased production.
Parting thoughts
The cake washing data presented here illustrate the value of actual wash plots per Ref. 1, as well as the importance of accurate impurity mass balances on the washing process to assess non-ideal effects and cake non-uniformities. Only in this way can differences in wash parameters be determined and compared.
The data here also demonstrate the improved washing performance of the new-style Klinkau membrane plates, as well as the general washing effectiveness of the membrane recessed chamber filter presses [excellent impurity removal recessed chamber filter presses (i.e., excellent impurity removal at reasonably modest N values and excellent cake uniformity)].
Acknowledgment
The author wishes to acknowledge the excellent help of Wallace Leung, Ph.D., Hong Kong Polytechnic University and Jay Lozier of Baker-Process, Inc. (now part of Arus-Andritz) for their invaluable help with this project.
References
1.Wakeman, R.J., and Tarleton, E.S., “Filtration,” 1st edition, Elsevier Science, Ltd., Oxford OX5 1GB, United Kingdom, (1999).
2. Slottee, S., Paper presented at 9th Annual Technical Conf. & Expo, Valley Forge, PA, April 21-24, 1996: “Cake Washing in Filtration Operations for Increasing Product Purity and/or Recovery of Soluble Values: Testing, Design, Trouble-shooting and Optimization of Commercial Applications.”
3. Collins, R., and Pickering, T., Paper presented at 10th Annual Technical Conf. & Expo, Minneapolis, MN, April 29-May 2, 1997: “Comparative Performance of Centrifugal and Pressure Filtration.”
4. Tichy, J.W., and Steidl, A.D., Paper presented at 11th Annual Technical Conf. & Expo, St Louis, MO, May 4-7, 1998: “Dewatering, Washing, and Drying of Filter Cake with Steam on BHS-Filters.”
5. Paavola, N., and Oja, M., Paper presented at 12th Annual Technical Conf. & Expo, Boston, MA, April 6-9, 1999: “Washing and Dewatering of Different Starches in Pressure Filters.”
6. Mayer, E., Fluid/Particle Separation J., (4), 182-185 (1990).
7. Mayer. E., Fluid/Particle Separation J,. 6 (1). 4-9 (1993).
8. Mayer, E., and Wood, J.G., Fluid/Particle Separation J. 9 (3), 218-227 (1996).
9. Heuser, J., and Stahl, W., Paper presented at 11th Annual Technical Conf. & Expo, St. Louis, MO, May 4-7, 1998: “The Influence of Non-Ideal Effects on Cake Washing and Their Experimental Analysis.”


