As the importance of indoor air quality becomes more widely understood, high-efficiency HVAC filters are rising to prominence. However, some critical questions still need to be answered. Researchers from 3M, Emerson and LMS Technologies have recently collaborated in a series of scientific studies to answer critical questions regarding the performance of high-efficiency HVAC filters and room air purifiers in a variety of application scenarios. Their research results are being published in series of articles in International Filtration News. The following article is Part III in this series. Part II in the series is “Effectiveness of HVAC filters and room air purifiers in mitigating indoor particulate matter.” Part I in the series is “Virus filtration performance of residential HVAC filters.”
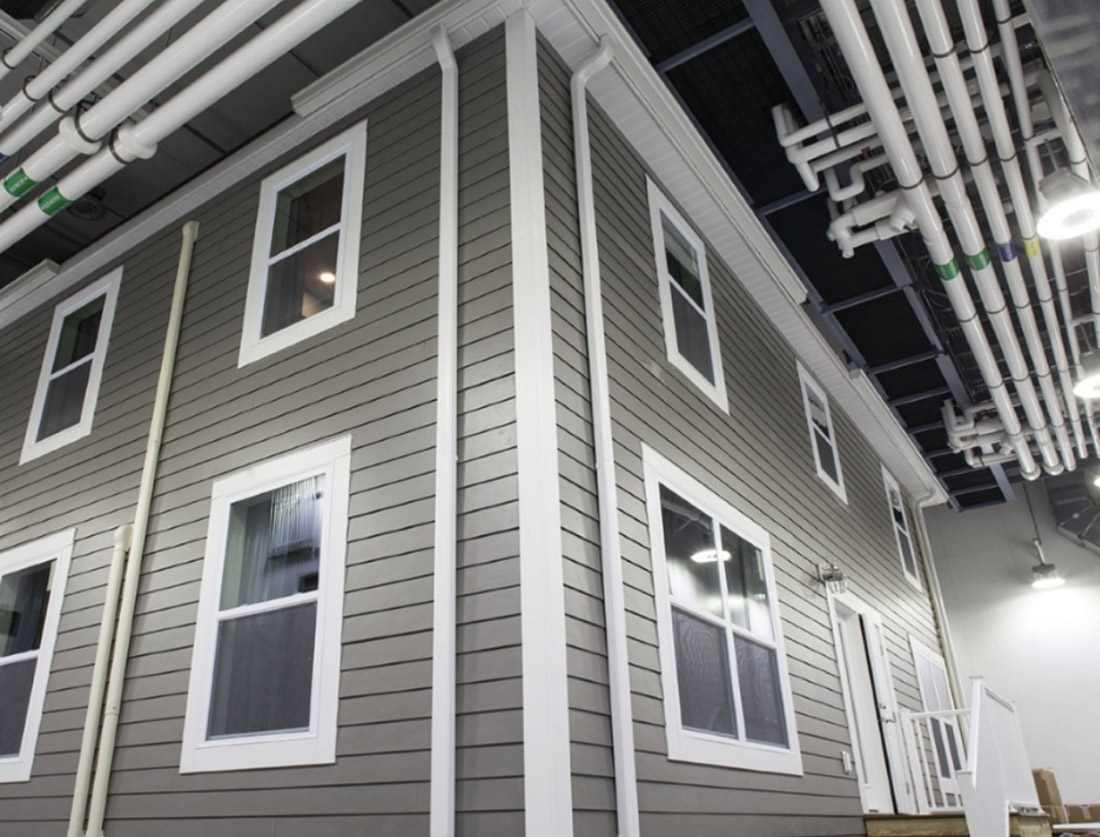
A comprehensive study was conducted to understand: (1) the relationship between filter efficiency and CADR (clean air delivery rate) and reduction of the PM (particulate matter) concentration in a house with a forced-air residential HVAC (Heating Ventilation air-Conditioning and Refrigeration) system; and (2) the interaction between the event room, where the PM is generated, and other rooms based on different filters and RAP (room air purifier) configurations. The study was conducted at the Emerson Helix Innovation Center in Dayton, Ohio, using its one-of-a-kind 2,000 square foot, fully functional Residential Home. The home is housed inside an environmental chamber, enabling accurate simulation of diverse indoor and outdoor climate conditions where experiments can be conducted with an unprecedented level of precision and consistency, at a speed unachievable in a real-world setting.
In this study, the energy consumption of the HVAC system in the Helix Home was accurately measured across filters of different efficiency levels. Outside ambient conditions and inside temperature set points were consistent across all filters tested. This approach allowed researchers to clearly understand the impact of filter efficiency on energy consumption and static pressure drop.
This study concluded that: (1) high-efficiency filters had a negligible impact on HVAC energy consumption when compared to fiberglass filters; (2) high-efficiency filters maintained the same level of energy consumption throughout the designed service life; and (3) high-efficiency filters do not necessarily have higher pressure drop versus lower-efficiency filters, because the filter pressure drop depends mostly on the filter media and filter design, not necessarily on the filter efficiency.
Background
Severe air pollution has attracted high levels of public attention. Especially extreme air pollution in regions such as China, India and the Gulf, has further increased global concerns about the air quality in recent years. As the awareness of air pollution increases, people want better filtration products to improve the air quality in their homes. In the United States and Canada, indoor air quality (IAQ) has become a major public concern. Scientific studies[1] revealed that indoor pollutants such as secondhand smoke, combustion pollutants, molds and pet dander, as well as gaseous and vapor pollutants, e.g. radon, carbon monoxide, nitrogen dioxide and volatile organic compounds (VOCs), have significant negative impact on public health. In recent years, high-efficiency filters are used more and more extensively in residential HVAC (heating ventilation and air-conditioning) systems as a major means for improving indoor air quality of residential homes.
However, while consumers embrace the concept of high-efficiency filtration, there is a perception that high-efficiency filters restrict airflow in the HVAC system, making the system work harder to condition the home. The energy consumption of a HVAC system is often considered as an indication of how hard the system works. Therefore, some HVAC professionals recommend not using high-efficiency filters.
On the other hand, many scientific studies have indicated that high-efficiency filters do not necessarily consume more energy than lower-efficiency filters in home environment. Wilcox et al[2] and Parker et al[3] found that performance of HVAC highly depends on the airflow and reducing the watt draw of furnace fans and other central system air handlers provides significant peak demand savings. Nassif [4] found that with a constant-speed fan, the cooling energy use increases as the filter gets dirty over time and the energy use in the fan may increase but this depends heavily on the investigated fan performance curve.
A study by Fazli, T., et al. [5], showed that moderate increases in static pressures were predicted to yield minimal increases in annual space conditioning energy costs (i.e., less than 3% across all homes, blowers, and climates).
Stephens et al.[6] monitored 17 residential and light-commercial forced-air-cooling systems in Austin, Texas. They discovered that higher-efficiency (MERV 11-12) filters generally had a small impact on parameters related to cooling energy consumption in the residential and light-commercial HVAC systems when compared to lower-efficiency (MERV 2) filters. Stephens et al.[7] in another study concluded that the magnitude of filter impacts on energy is especially insignificant when compared to other common air-conditioner operation and maintenance issues. Walker et al.[8] found that in most cases high-efficiency filters, up to MERV 13, had a negligible impact on energy consumption and only MERV 16 filters could consume more than 5% energy compared to low efficiency filters. Lutz et al.[9] developed numerical models to estimate the energy consumption of residential HVAC systems.
Previous studies were mostly based on theoretical modeling of HVAC systems. Some limited experimental studies were conducted with many compounding factors, making it difficult to draw a clear conclusion on the energy impact of filters. In this study, the energy consumption of the HVAC system in the Helix Home was accurately measured across filters of different efficiency levels. Outside ambient conditions and inside temperature set points were consistent across all filters tested. This approach allowed researchers to clearly understand the impact of filter efficiency on energy consumption and static pressure drop.
System description
This study was conducted at the Emerson Helix Innovation Center. The Emerson Helix Innovation Center is a 40,000-square-foot facility located on the University of Dayton campus in Dayton, Ohio, focused on providing a collaborative environment for researchers, academia and industry professionals to develop solutions to industry challenges. The facility is uniquely suited to enable cutting-edge testing in simulated real-world environments. To allow for accurate and repeatable testing of filter impacts on energy and performance in a real-world setting, testing was conducted in the Helix Home Module.
The Helix Home Module is comprised of a fully furnished and fully operational 2,000 square foot, two story residential home, housed within a sealed environmental chamber. This setup allows researchers to control outdoor ambient conditions with temperatures ranging from -20 F to 120 F and humidity from 20%RH to 90%RH.
For this testing, the home was conditioned with a central forced-air heat pump system featuring a Carrier 25HCB636A310 condensing unit with an Emerson Copeland ZPS31K5-PFV-230 compressor locked to high stage, and a Carrier FX4DNF037L00ACA furnace with 15 kWh of electric heat energized as one stage, and variable speed Endura 1/2hp FM19 ECM blower motor. The system is ducted in a downflow configuration with two air return vents, one on the first floor and one on the second. To track system conditions, the home is outfitted with a Yokogawa GM10 data acquisition system with analog input and digital input channels allowing for thermocouple temperature inputs and system equipment state logging. Additionally, Yokogawa PR300 Universal power meters are used to track power consumption of all critical system elements. Humidity is tracked using Omega HX71-V1 humidity sensors and Omega PX653-01D5V are used to measure pressure differentials. The home is also outfitted with lighting, electronics, appliances, and plumbing, all representative of a similarly sized residential home.
Testing method
High ambient testing was conducted with the environmental chamber set at 95 F and 50%RH with the home’s indoor cooling setpoint set at 72 F with a ±1 F dead band. Low ambient testing was conducted with the environmental chamber set at 40 F and 50%RH with the home’s indoor heating setpoint set at 70 F with a ±1 F dead band. Prior to the start of testing, the home and environmental camber were allowed to stabilize for 48 hours for both high and low ambient conditions ensuring steady state operation. For both testing states, every effort was made to eliminate variable loads, although some minute variability was still encountered as would be expected in any real-world home.
In order to maintain a consistent number of heating or cooling cycles for each test, the lights in the home were left on to help add additional heat load into the home during high ambient testing, and during low ambient testing lights were turned off eliminating unneeded excess heat load.
To conduct tests, the appropriate filters were first installed in both the upstairs and downstairs return air ducts. For loaded filter tests, filters were weighed prior to installation to ensure that the proper amount of ASHRAE loading dust was indeed present at the test of start of testing. The home was then vacated and allowed to cycle normally for a minimum of two hours while system data was recorded with the Yokogawa GM10 DAC system on one-second intervals.
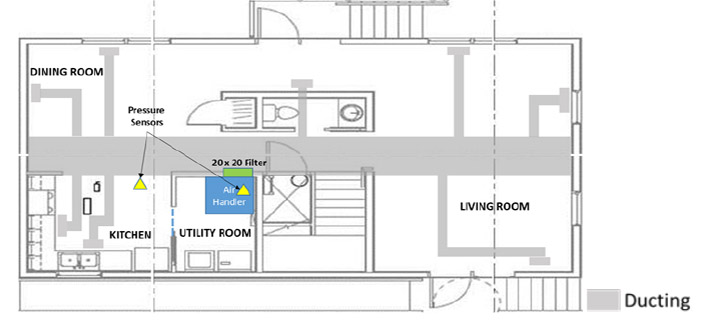
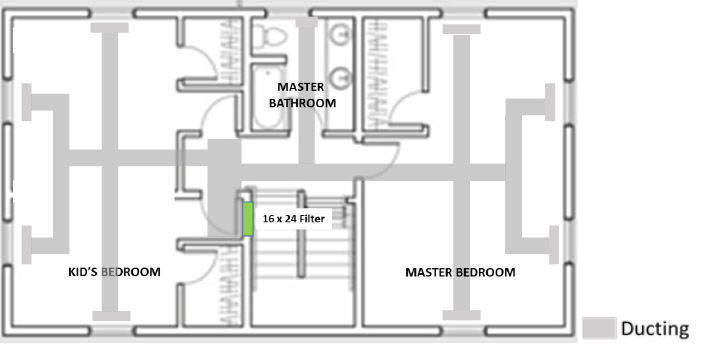
The pressure differential within the system was also tracked during testing. The atmospheric pressure of the home and the atmospheric pressure of the collective return air duct before it passes the indoor coil were simultaneously measured and the difference between the two was logged. The positioning of the differential-pressure sensor, as well as the layout of the ductwork in the home, is depicted in Figures 2 & 3. This differential pressure is referenced as the collective filter pressure drop in this paper.
In monitoring system energy consumption, the following parameters were metered:
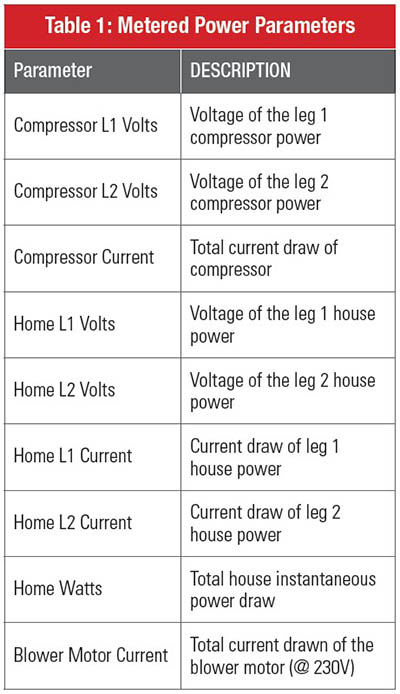
Observations
During low ambient testing, instantaneous power consumption consistently crept over the course of a heating cycle, a phenomenon not seen in high ambient cooling cycles. This is primarily attributed to the decreasing efficiency of heat pump systems as the condensing coil temperatures are more prone to saturation at low ambient conditions, negatively affecting overall efficiency.
Additionally, short, yet significant, spikes in whole home energy consumption were encountered every four hours during low ambient testing. These spikes correspond with the required heat pump defrost cycles, during which the furnace electric heat is momentarily energized to help increase condensing coil temperatures and mitigate potential frost buildup.
While all tests were run for a minimum of two hours, and the system had achieved steady state cycling, the data does show that there were some subtle differences in system cycle times and total runtimes over the evaluated two-hour windows. These differences can largely be attributed to the minute uncontrollable changes in indoor and ambient loads over the course of testing. As such, results may exhibit some minor skew, with an overall negligible impact.
Descriptions of filters
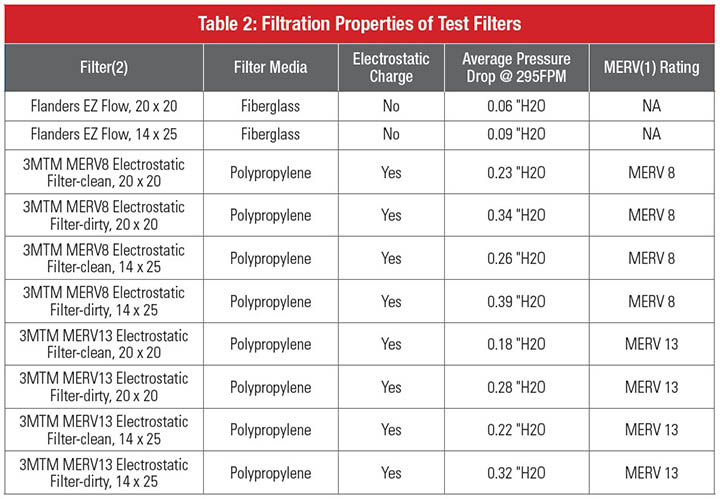
Three types of filters were selected for this study to represent typical low, medium and high-efficiency filters used in residential homes. The first type of filters were fiberglass filters, Flanders EZ Flow, which were selected as a baseline to represent low efficiency filters. The second type of filters were 3M MERV8 filters, representing the mid-range high efficiency filters. The third type of filter were the 3M MERV13 filters, representing high-efficiency filters. The Emerson Helix Home Module has two return air filter inlets: a 14” (width) x 25” (length) x 1” (depth) inlet and a 20” x 20” x 1” inlet. In this study, filters of two different sizes: 14 x 25 and 20 x 20, were used. For each filter size, two filter samples were tested. For MERV 8 and MERV 13 filters, dirty filters were also used for this study. The dirty filters were loaded with ASHRAE Dust to reach a 50% increase in pressure drop, which represents the typical pressure drop increase of 3M filters in their designed service life. The properties and characteristics of test filters are shown in Table 2. The MERV 8 and MERV 13 filters are both electrostatically charged filters. Please note that the pressure drop shown in Table 2 was measured per ASHRAE 52.2 test standard, i.e., the pressure drop across a filter at the described air face velocity in the ASHRAE 52.2 test duct.
- MERV: Minimum Efficiency Rating Value per ASHRAE 52.2 standards at 295 FPM.
- 2 samples of each size of each type were used for this study. Pressure drop value is the average of 2 samples at 295 FPM air face velocity.
We had also prepared dust-loaded fiberglass filters. However, dust particles fell off fiberglass filters easily and would cause contamination in the test system. Because of severe dust shedding, dirty fiberglass filters were not used in this study.
Results and analysis
To study whether highly efficient filters negatively impact the heating and cooling system performance, the energy consumption was measured while different types of filters were tested. The energy consumption of the HVAC system will increase if the system is under stress. Three different types of filters were tested: fiberglass, 3M MERV 8, and 3M MERV13 (MPR 1900) filters. MERV 8 and MERV 13 filters were tested both clean and dirty to understand whether the HVAC system would undergo appreciable stress at beginning and end of life. Each of these five filter types had one replicate for a total of ten unique samples in this study. The system was run in a simulated heating season, with an outdoor temperature of 40 F, and in a cooling season, with an outdoor temperature of 95 F. The same filters were used in the system during the heating and the cooling simulations.
Due to the automation of the test design, filters were tested for various amounts of time. For this analysis, we chose to analyze only the first two hours of use. All pressure-drop readings correspond to the collective system pressure drop, as described in the Testing Method section, during the heating or cooling cycles. The system includes two filter sizes, 20 x 20 and 14 x 25, each with the same filter type. The average collective filter pressure drop in the HVAC system was calculated for when the pressure differential value was not zero, which corresponds to when the systems fan was running. Figure 4 shows the average collective filter pressure drop in the heating season. Figure 5 shows the average collective filter pressure drop in the cooling season.
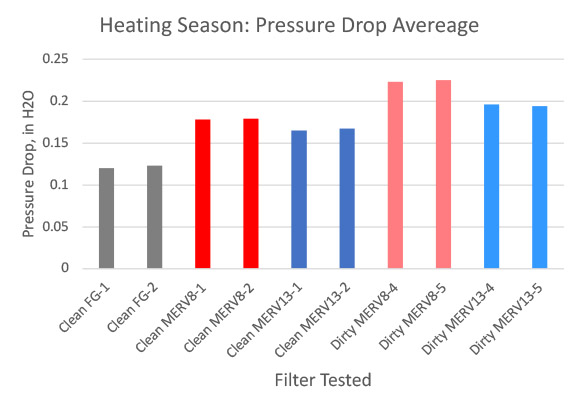
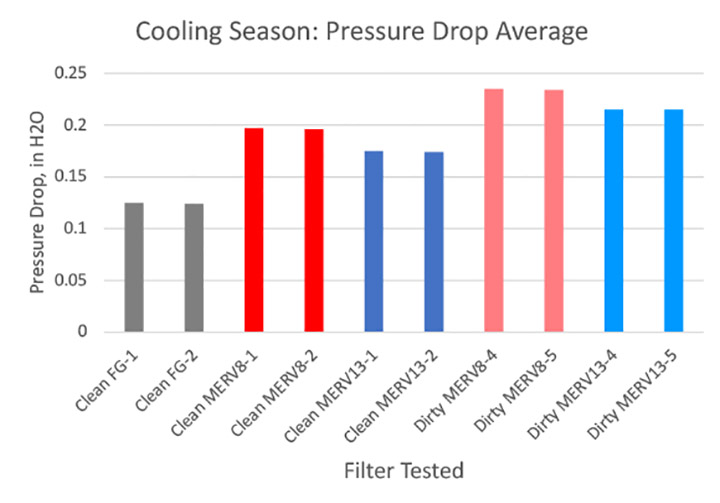
As seen from Figures 4 and 5 (also seen Table 2), the higher efficiency MERV 13 filter had lower pressure drop than the lower efficiency MERV 8 filters. The pressure drop of a filter depends on filter media and filter design. By selecting appropriate media and optimized filter design, a higher-efficiency filter can have lower pressure drop.
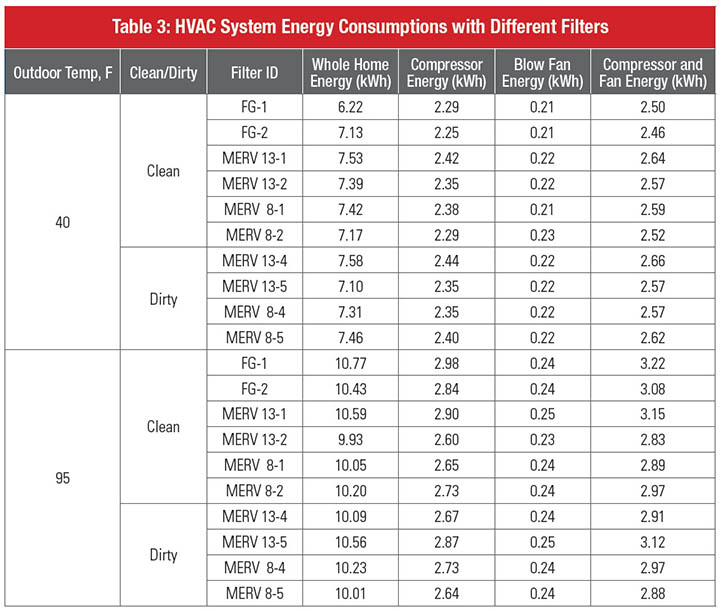
To calculate the total HVAC energy consumption, the fan power and the compressor power were measured separately and then combined for HVAC system energy consumption. Again, this analysis was focused on the first two hours of use. Gradual increases in energy consumption were observed during each power cycle during the heating system.
Like the power, the energy consumption of the compressor and the fan were calculated separately, and then combined to get the total HVAC energy consumed. The total energy was calculated by summing energy consumption over the first two hours of run time for each filter set tested.
*The discrepancy seen in whole house energy consumption between the clean fiberglass filter 1 and clean fiberglass filter 2 can be attributed to the lack of a heat pump defrost cycle in clean fiberglass filter 1 test.
Figures 6 and 8 show the energy consumption of the HVAC system in the heating season test and cooling season test respectively. The results indicate that HVAC energy consumption remained at similar level regardless of filter types. Figures 7 and 9 show whole house energy consumption in the heating season test and cooling season test respectively. With exception of FG-1 filter in the heating season test, for which the discrepancy was attributed to the lack of a heat pump defrost cycle during that test, no matter which filter was used, the whole house energy consumption remained relatively the same. In other words, the energy consumption was not sensitive to filter pressure drop for filters up to MERV 13.
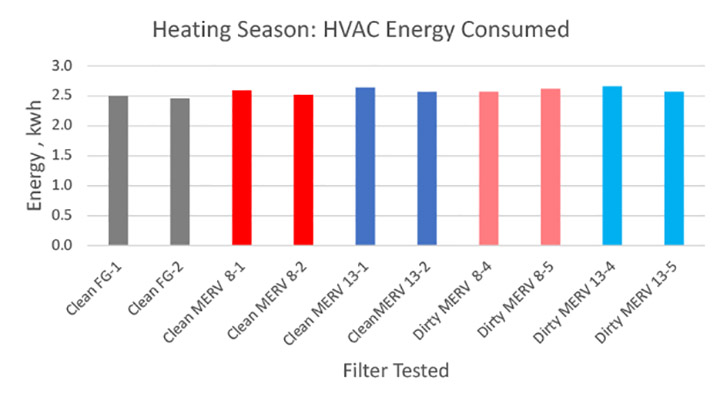
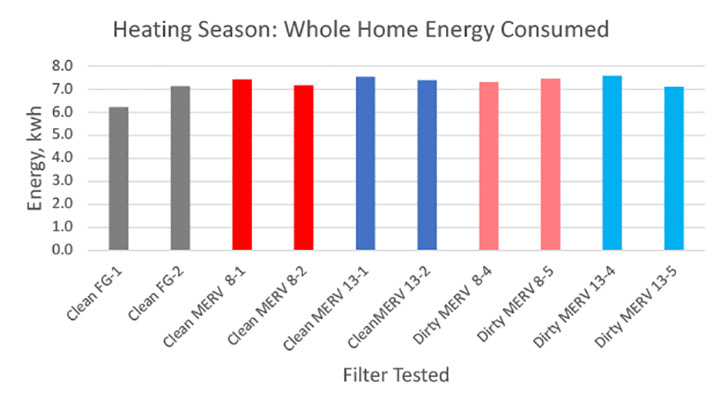
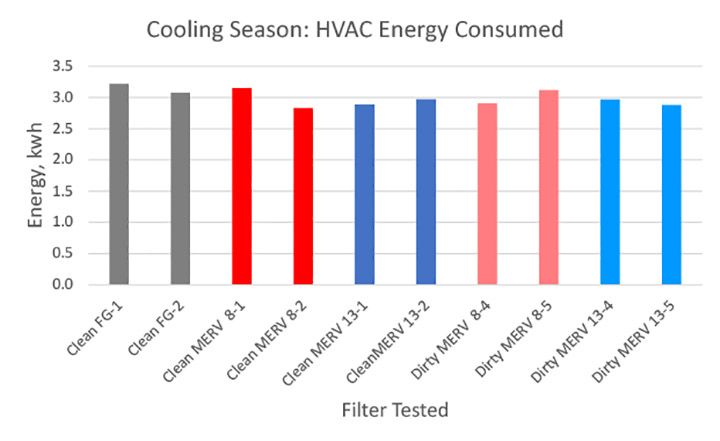
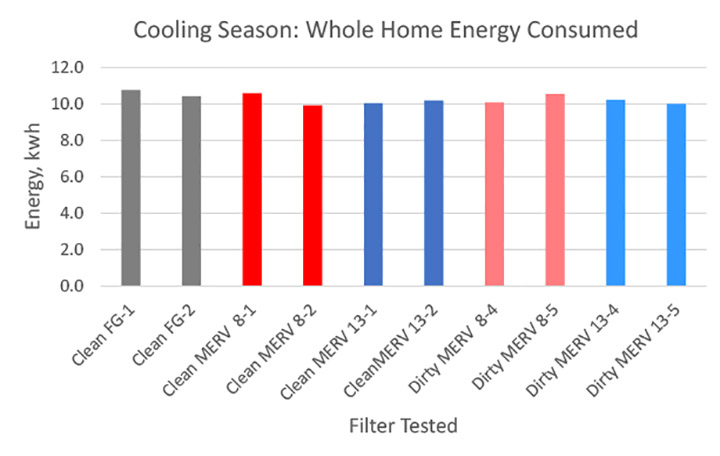
It is even more revealing to see that the HVAC system energy consumption with the highest pressure drop filter, i.e. dirty MERV 8 filter, was still essentially at the same level as with the lowest pressure drop filter, the clean fiberglass filter. The similar trend was found in both heating season and cooling season tests (see Figures 6 through 9).
Conclusions
This study revealed several important facts of HVAC filtration. First, high-efficiency filters had negligible impact on HVAC energy when compared to low efficiency fiberglass filters. 3M filters achieve high-performance filtration by use of electrostatically charged fibers, which enable the filter to capture more particles with fewer fibers. Therefore, high-efficiency 3M filters can deliver excellent filtration without causing extra energy consumption. Consumers can enjoy the benefits of high-efficiency filtration without paying more for their energy usage or damaging their HVAC equipment.
Secondly, dust-loaded filters had minimal increase in energy consumption when compared to clean filters. As discovered in the study, the difference in energy consumptions between clean 3M filters and dirty 3M filters was negligible. It was evident that 3M filters can maintain the similar level of energy consumption throughout the designed service life of the filter.
Lastly, higher efficiency filters do not necessarily have higher pressure drop than lower efficiency filters, because the filter pressure drop depends mostly on the filter media and filter design, not necessarily on the filter efficiency.
References
- EPA 402/F-08/008, September 2008.
- B. Wilcox, J. Proctor, R. Chitwood, K. Nittler, “Furnace Fan Watt Draw and Air Flow in Cooling and Air Distribution Modes,” 2008 California Building Energy Efficiency Standards, 2006.
- D.S. Parker, J.R. Sherwin, R.A. Raustad, D.B. Shirey, “Impact of evaporator coil airflow in residential air-conditioning systems,” ASHRAE Trans. 103 (1997)395–405.
- N. Nassif, “The impact of air filter pressure drop on the performance of typical air-conditioning systems,” Build. Simul., 5 345–350, 2012, http://dx.doi.org/10.1007/s12273-012-0091-6.
- Fazli, T., Yeap, R. Y., & Stephens, B., “Modeling the energy and cost impacts of excess static pressure in central forced-air heating and air-conditioning systems in single-family residences in the US. Energy and Buildings,” 107, 243–253, 2015.
- B. Stephens, J.A. Siegel, A. Novoselac, “Energy implications of filtration in residential and light-commercial buildings” (RP-1299), ASHRAE Trans., 116 (2010) 346–357.
- B. Stephens, A. Novoselac, J.A. Siegel, “Impacts of HVAC Filtration on Air-Conditioner Energy Consumption in Residences,” Proceedings of Healthy Buildings 2009, Paper 474.
- I.S. Walker, D.J. Dickerhoff, D. Faulkner, W.J.N. Turner, “Energy Implications of In-Line Filtration in California,” Lawrence Berkeley National Laboratory, Berkeley, CA, 2012, Report No.: LBNL-6143E.
- J. Lutz, C. Dunham-Whitehead, A. Lekov, J. McMahon, “Modeling Energy Consumption of Residential Furnaces and Boilers in U.S. Homes,” Lawrence Berkeley National Laboratory, 2004, Report No.: LBNL-53924.


