Abstract
Auxiliary systems like the Synthetic Oil Mist Separator (SOMS) are used as an essential service to gas turbines. They are designed mainly to restrict aerosol emissions to the atmosphere. Aerosols emissions from gas turbines are composed of small oil particles of varying sizes, ranging from 1nm to 1,000 nm. For this application, the aerosol is called “oil mist” because the temperature of the fluid is lower than vapor temperature during the dispersed phase resulting in the mist. It is a sub-product of the gas turbine during operations. The amount of oil mist produced is influenced by time and other operational conditions of the gas turbine (rpm, energy production, wear, etc.). In this study, we analyzed oil mist production from a gas turbine on site at two different operational conditions: Core Idle, when the gas turbine did not produce energy, and Full Load during energy production. The SOMS was designed to collect and separate oil from air, by coalescence, whereby millions of oil droplets moving through the SOMS and the microfiber cartridges combine together to form larger size drops. These larger drops drain downwards and are collected at the bottom of the SOMS. Knowing the actual efficiency of the SOMS at operational conditions of the gas turbine is important, due to environmental limitations for emissions. Indeed, there are regulated limits to the total amount of oil that can be released into the atmosphere in these applications. This limit is recommended to be lower than 5 mg/m³[1] in accordance with OSHA Permissible Exposure Limits (PEL). Nevertheless, it is not trivial to estimate the actual amount of oil released into the atmosphere. Literature shows that researchers are still involved in studying procedures to make a comprehensive and standard method for qualitative and quantitative analysis. In this paper, we present our approach and results for in situ measurements. The measurement methods presented here were first evaluated in laboratory on a SOMS. Then these methods were used to evaluate the performance of the SOMS in situ on a gas turbine under operational conditions. Based on these results we believe that this protocol can be a good candidate to become a standard for in situ measurement of the efficiency of SOMS. Currently, many other improvements are under investigation.
Introduction
In a gas turbine, oil mist mainly comes from the lubricating fluid spilling out of the seals of the bearings placed along the shaft. To prevent the lubricating fluid from spilling out of the of the sealing systems, sealing air is injected. This air mixes with the oil and returns with the fluid to the main lubricating oil tank. In this “return/release” line, the oil is emulsified with the trapped sealing air. When it reaches the main lubricating oil tank, the oil expands, thus generating oil mist and positive overpressure [2,13,14].
Dedicated systems, like the Synthetic Oil Mist Separator (SOMS), are designed to separate the oil from air/oil mist from turbine, in order to 1) aid venting of oil free air; and 2) recover the oil mist from the air flow with the dual goal of minimizing lube consumption and avoiding atmospheric pollution [15]. The results reported in this paper describe a method for evaluating the performance of a SOMS in situ.
The SOMS (Filters SpA)
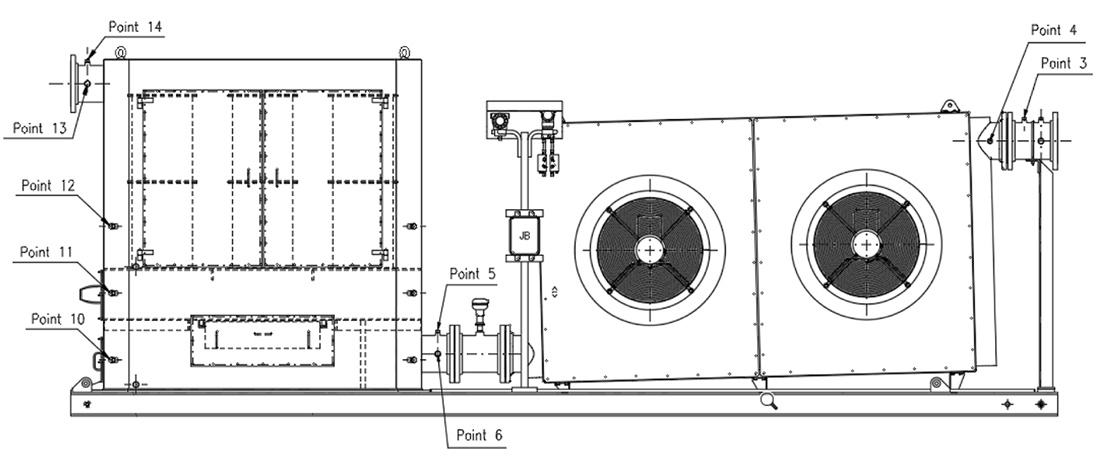
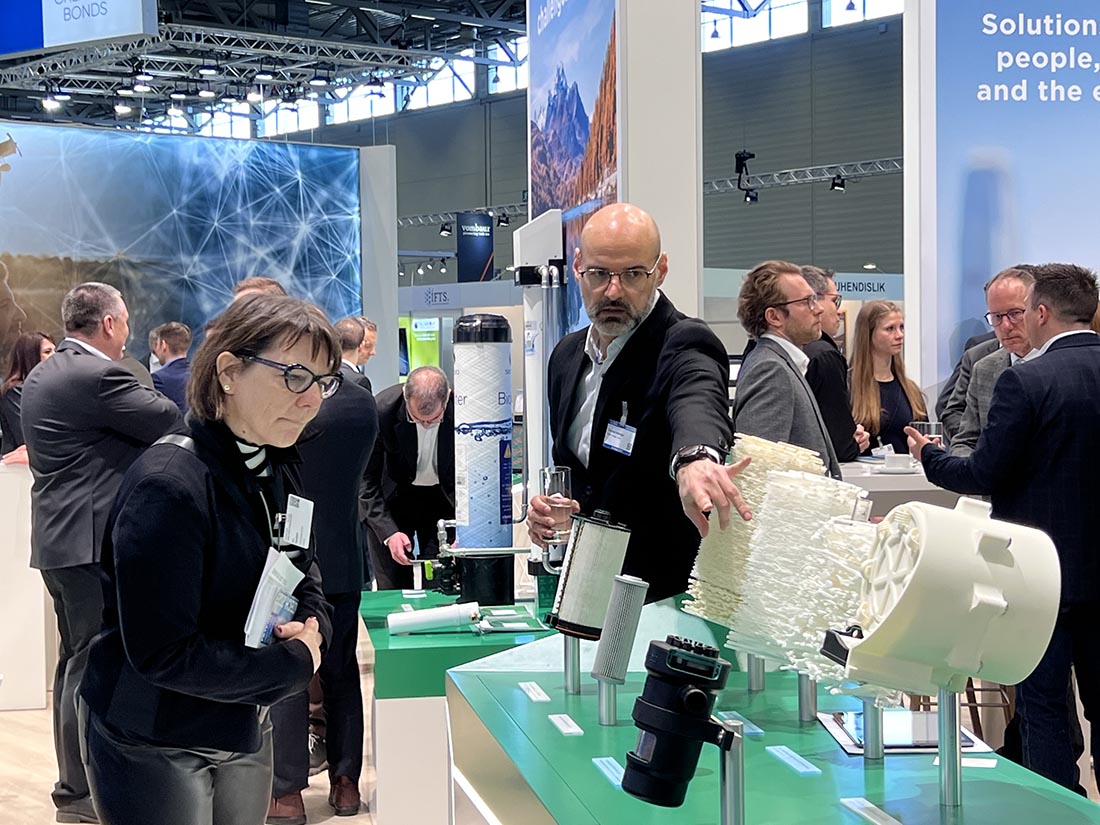
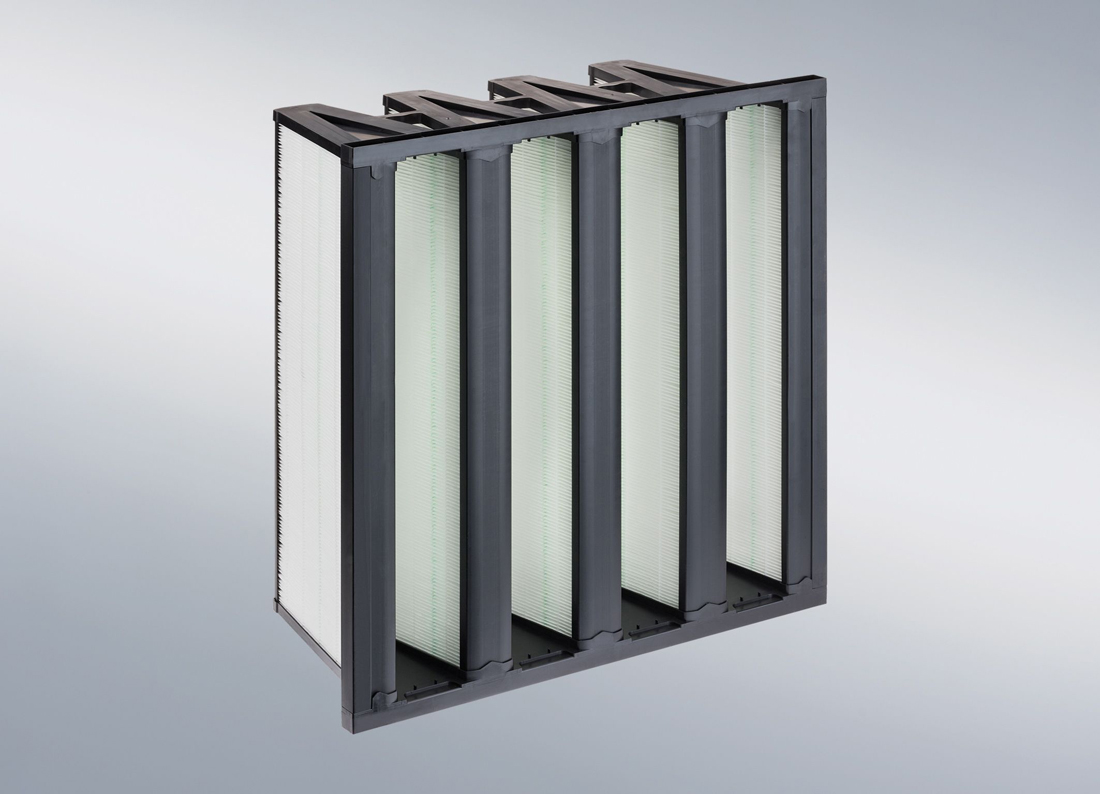
The SOMS used in this study is shown in Figure 1.
It is designed to be installed as an auxiliary system to an aeroderivative gas turbine to reduce oil emissions in the atmosphere. The SOMS is designed for a maximum design inlet temperature of 175 C. The inlet is on the right side while the outlet is on the left.
The SOMS is designed with two parts: a cooling system and a separator box, where the coalescing cartridges are located. The SOMS is designed for oil in the gaseous phase thanks to a cooling step and, subsequently, a coalescence one. At inlets to the SOMS (point 3 and 4 – Figure 1) hot aerosol mist flows in from the lube oil tank at a temperature typically between 90 C and 120 C. The hot gas is cooled in a cooler with two fans to bring the aerosol mist to room temperature before reaching the filter cartridges. At this stage, because of the cooling, part of the oil contained in the mist is condensed to liquid and removed from the gas. The oil is then collected at the bottom of the cooling system. To aid in the draining of the oil, the cooler with the fans is installed at an incline (Figure 1).
Experiments
The goal of this study was to evaluate the in situ efficiency of the SOMS. The efficiency of the SOMS was determined from the oil concentrations before and after the SOMS in situ on a full scale gas turbine under different operating conditions.
The main objectives in the laboratory were to determine the optimal limits and ranges of the variables measured and for the respective measurement methods so that these can be adopted for the in situ measurements. The in situ testing was conducted on a full-scale aeroderivative gas turbine.
Measurement instruments and devices
To ensure redundancy in the measurements, three different methods were used for measuring oil concentrations in the air flow from the gas turbine: gravimetric, spectrometric and Dräger measurements. This redundancy was to ensure that valid data are obtained even if the concentrations and temperatures at a sample point exceeds the limits of one or more of the methods used.
- Gravimetric Measurements; the aerosol was sampled at a known flow rate (i.e., if needed a pump was employed, when the flow rate was too low for the sampling) and collected on a filter membrane (MCE by Millipore) with 37 mm diameter, 0.8 µm pore size, supported by polystyrene cases hosting a cellulose membrane. Membranes were transported on field in a desiccator and were stored in a desiccator after sampling. The samples were weighted with a balance having a sensitivity of three digits (i.e., 0.001 g; by ORMA – Scientific Instruments, series BC). The total amount of oil collected is then determined by the change in the weight of the membrane after sampling.
- Spectrometric Measurements for size discriminated particle concentration measurements using two commercial instruments
a. TSI Nano scan model 3910, electric mobility scanner, particle size range 0.01 – 0.42 µm, concentration: 100 – 1,000,000 particles/cm³. Sample flowrate up to 0.7 l/min.
b. TSI Optical Particle Sizer model 3330, particle size range 0.3 – 10 µm concentration: <3,000 particle/cm³, flowrate up to1 l/min. Both of these instruments provide real-time particle size discriminated concentrations within their respective size and concentrations. Where the concentrations are too high, a diluter is required and was used. - Dräger Tube Measurements (Tube pump Dräger X-act 5000). This is a standard method for the measurement or sample taking of gases, vapors and aerosols for chemical and other analyses [16]. In this method, the sample to be measured is trapped in a sorbent sampling tube like silica gel or activated charcoal. The collected sample is then analyzed thanks to a reaction with sulfuric acid and thanks to a colorimetric scale provided by the supplier. Dräger test was performed at the outlet evaluating effective emission level in relation to emission limits (i.e., maximum concentration detectable was 10 mg/m³).
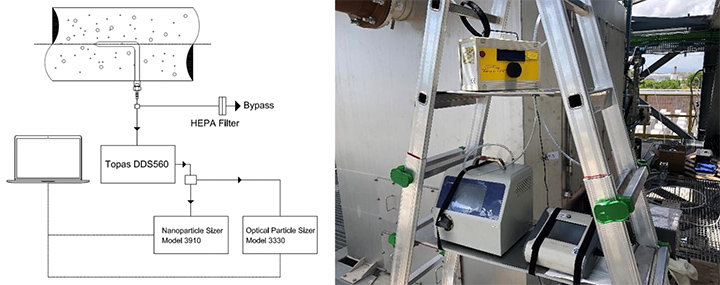
For all these measurements, and especially the spectrometric ones, a diluter (Topas model DDS560 dilution ratio up to 1:370 , flow rate up to 3.0 l/min) was used as needed when the aerosol concentration was outside the limits of the instruments.
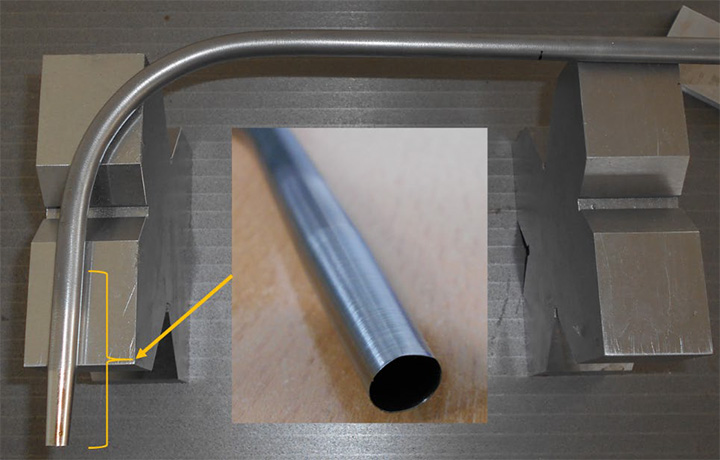
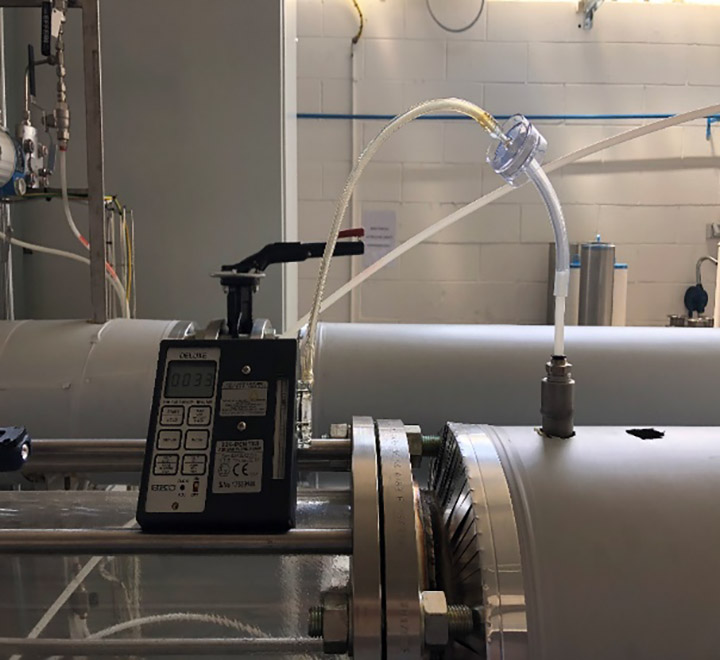
For sampling from the air flow, a custom-made Monel alloy hooked probe was employed (Figure 2). This probe was machined to obtain a thin wall cross section at the inlet. Among the three probes tested on the test bench, that one having a diameter of 8.0 mm was employed. This probe permitted sampling of higher volumes without overcoming detection limits, thanks to the bypass presence. The probe had a diameter of 8 mm with a ratio between external diameter to internal diameter lower or equal to 1.1 (i.e., D/d ≤ 1.1) in accordance with the studies of Baron et alii [4,5]. The inlet of the probe was positioned at countercurrent to air flow, i.e., facing the flow. Although it is desirable to sample isokinetically, due to the variability of the gas (i.e., aerosol) flow and oscillations of the fluid temperature, it was impossible to maintain isokinetic conditions for the entire sampling time of about four hours. Nevertheless, following the work of others in the field, sampling as close as possible to isokinetic conditions was maintained [6,8,9].
Measurements
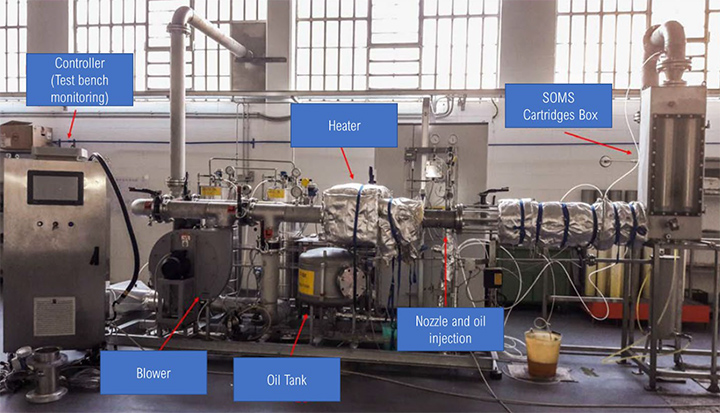
Tests in laboratory were conducted on a 1:1 SOMS system (test bench – Figure 3). The objective was to replicate on-field conditions for the SOMS. The laboratory measurements permitted us to evaluate the measurement procedures for determining the efficiency of the SOMS and also to establish the limits for each measurement technique noted above. The main difference in the laboratory compared to the in situ conditions in the field, was the oil mist concentration in situ was not constant during all periods of the testing because of different operational conditions of the turbine.
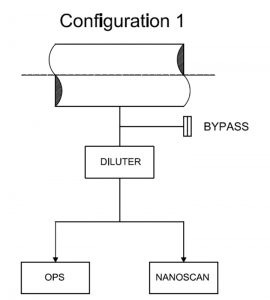
From the laboratory tests, it was possible to choose the optimum configuration with by-pass for the spectrometric measurements (Figure 4).
A bypass valve was used to protect against the possibility that the sampling probe would collect a higher flow rate than the sum of the single maximum spectrometer flow rate. If this level was reached, the spectrometer would abort the measurement. Thus, the by-pass avoided possible overflow errors related to the instruments.
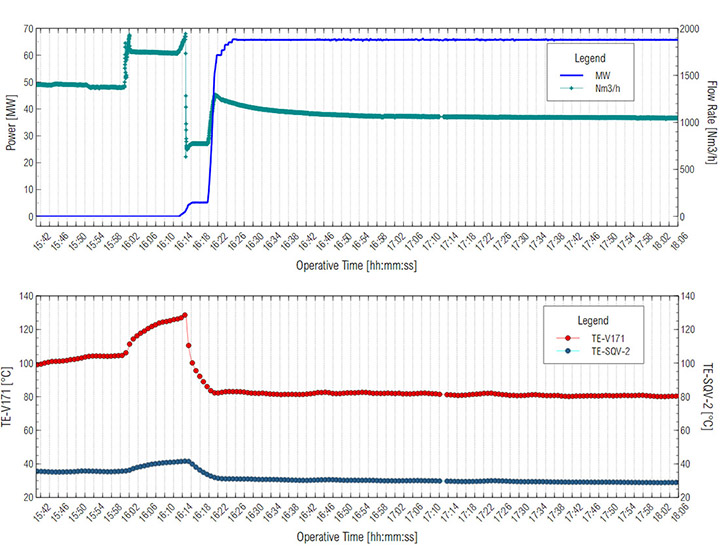
With the gravimetric measurement, the maximum time for gravimetric sampling was estimated to be 10-15 minutes to avoid saturation of the membranes on the cassettes as a function of oil concentration in the aerosol. In situ oil concentration and oil particle distribution measurements were evaluated at two different turbine operating conditions: a) Core Idle conditions, where variables such as flow rate, power and temperature had a higher variability and b) Full Load conditions, where operational variables were more stable. Gas turbine operational conditions were monitored continuously. Both power and temperature were stable during this work, during the Full Load (Figure 5).
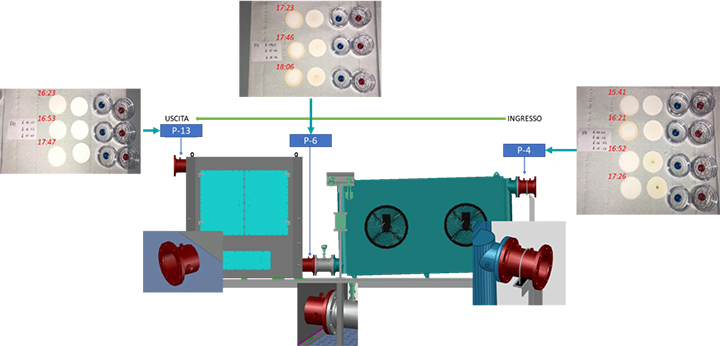
For each test condition of the turbine, three probes were installed at three different points along the SOMS: point 4, 6 and 13 (called P4, P6 and P13 respectively). The axis of the probe was positioned in the center of the pipe. The output of the probe was connected via polypropylene (PP) tubing to the gravimetric or spectrometric measurements. All tubing was cleaned with 2-propanol before the analysis, to remove traces of organic contaminants and humidity before each measurement.
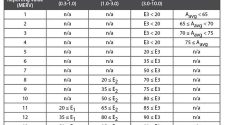
Referring to Figure 1, starting from points 4 and proceeding from right to left up to points 13, the oil concentration was determined. Due to the temperature limitations for the method, spectrometric measurements were only possible for points 6 and 13 (Table 1). Due to concentration limitations, the Dräger measurement, was limited to point 13. For sample points 4 and 6, where the oil concentration was one or two orders of magnitude higher, the use of Dräger measurement was not possible. Unlike the other two techniques, gravimetric measurements had no limitations and were used at all sample points. Similar procedures have been used elsewhere [2,3,10]. In this work, gravimetric analysis was limited to differential measurements. The concentration of oil in the air was determined from the measured mass of oil collected on the MCE membranes and the sample air flow. The methods used at each sample point are listed in Table 1, where the X in the box refers to the type of data that can be determined from the measurements. The #/m³ represents the number of particles per cubic meter.
| Point | Measurements | Operational Conditions | Conc. Analysis
[mg/m3] |
Distr. Analysis
[#/m3] |
| 4 | Gravimetric Measurement | 120 °C – 1.5 g/m3 of oil estimated | ☒ | ☐ |
| 6 | Gravimetric Measurement | 30-40 °C – <1.5 g/m3 of oil estimated | ☒ | ☐ |
| Spectrometric Measurement | 30-40 °C – <1.5 g/m3 of oil estimated | ☐ | ☒ | |
| 13 | Gravimetric Measurement | 30 °C – 0.5 mg/m3 of oil required | ☒ | ☐ |
| Dräger Tube Measurement | 30 °C – 0.5 mg/m3 of oil required | ☒ | ☐ | |
| Spectrometric Measurements | 30 °C – 0.5 mg/m3 of oil required | ☐ | ☒ | |
Table 1. Sampling points and operational conditions for the SOMS.
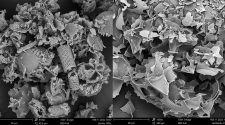
For gravimetric measurements, the membrane is made of two layers: the support layer and the MCE one. The two layers had different properties. The support layer was a cellulose-based pad. It had the structural function to keep the MCE stable during fluid flow. Part of the oil can be collected on this support layer. The MCE membrane exhibited a hydrophobic behavior and was resistant to high temperatures (up to 260 C). It had low tare mass needed for accurate gravimetric analysis (each membrane weighed 0.043 g). The MCE membrane employed had a medium pore size value, equal to 0.8 μm.
First, the membrane was cleaned with 50 ml of 2-propanol to remove traces of organic contaminants and humidity. The membranes were conditioned in a static oven at 105° for 30’. After 30’ the membranes were taken out of the oven, weighed individually, and together with a polystyrene case (i.e., cassette). Each case was weighed with its cap before the membrane were inserted. Then the membranes and the polystyrene cases (with caps) were weighed together. Four gravimetric measurements were taken for each sampling points (P4, P6 and P13 for a total of 12 cassettes).
After pretreatment and preparation of the membrane-layered structures, the cases were stored in a laboratory desiccator to avoid exposure to humidity. Each cassette was removed from the desiccator, attached to the sample tube and used for sampling, as shown in Figure 6.
A minimum sampling time of 10’ was used as determined from the laboratory tests with a flow rate of 150 Nm³/h at 25 C. It should be stressed the importance of defining a sampling time in advance was to prevent the risk of saturating the membrane with oil during on field measurements. When the membrane is saturated, the membrane will stop collecting oil. Thus the measurement may underestimate the oil quantity. In these conditions, the flux of air and oil that moves through the membrane tends to remove the oil that was collected on the membrane and flush it away. Hence the measurement will no longer be representative and will lead to errors in the measurements. In the field, it was observed that saturation did not occur even after 20’ – MEC membranes continued to turn from white to yellow minute by minute. Hence the in situ sampling was done for 15’ – 20’. The actual sampling time was recorded.
After sampling, the sample tube was sealed to stop gas sampling, and the cases were removed and capped to avoid contamination of the membrane. Each case was sealed in a plastic bag and stored in a desiccator ready for transportation to the laboratory to be weighed. At the laboratory, for each sample, the MCE membrane, pad and the whole cassette were weighed, and results were compared with initial values to estimate the oil quantity accumulated as the difference.
The types of measurement at each of the locations is shown in Figure 7.
For the spectrometric measurements, the layout with two spectrometers and a diluter mounted on a transportable ladder is shown in Figure 8 [7,11,12]. The same set up was used in the laboratories and in situ. As noted above, each spectrometer has an upper concentration limit. Whenever these limits are exceeded, the instruments will give an error message and no data is collected. To avoid this problem of high concentration, a dilution ratio of 1:50 was chosen, coupled with a bypass. This dilution ratio is expected to yield a good balance between not modifying the size distribution of the particles and staying within the acceptable concentration for the instruments.
The measurement was conducted at light overpressure conditions (i.e., 1.2 bar measured during all the period of the Core Idle and Full Load). During measurements, the sample flow rate was measured by an analog flow meter. A bypass valve was used to protect against the possibility that the sampling probe would collect a higher flowrate than the sum of the single maximum spectrometer flow rate. If this level was reached, the spectrometer would abort the measurement. This layout ensured that the correct fraction of the total flow reached the spectrometers. This solution did not influence data about dimensional particle distribution because of the aerosol statistical distribution approach.
The average particle size distribution of the aerosol was obtained from the spectrometers for each sample point. Five measurements of 1 minutes each were performed.
Sampling with Dräger short-term tubes followed the standard procedure provided by the instrument manufacturer [16]. The Dräger pump provides the required flow for the Dräger short-term tubes. Short-term tubes are intended for the measurement of momentary concentrations. The duration of a short-term measurement is usually in the range of 10 seconds to 15-30 minutes. The measured value shows the actual concentration during the time period covered by the test. One measurement corresponded to a defined volume in function of the type of the short-term tubes: this volume was chosen in function of vial dimension. For our application, Dräger pump performed 100 strokes (one stroke corresponds to 100 ml) for each measurement.
The vials (i.e., short-term tubes) employed contain acid that reacts with oil, and based on the amount of oil collected the color of the vial changes from white to black/dark. The sensitivity of the instrument (i.e., maximum detectable concentration of oil equal to 10 mg/m³) limited the employment to the output of the entire system and gave a quantitative and qualitative confirmation of the measurements conducted with gravimetric sampling and the spectrometry measurements. The Dräger pump measurements took about 30 minutes for each sample. At the end of each sampling, the Dräger vial directly gave the amount of oil collected.
Analysis of the results
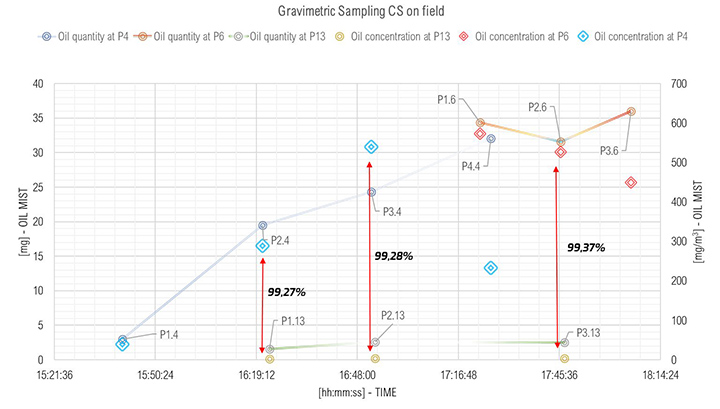
The results of the gravimetric measurements are shown in Figure 9. The abscissa showed the time of sampling. The y-axis shows the oil quantity collected in mg (on the left axis – lines with small markers) and its concentration in mg/m³ (on the right axis – larger markers).
Each point shown in Figure 9, corresponds to the locations shown in Figure 1. The PX.Y is interpreted as follows: X is the number of samples at that point; and Y refers to the sampling point location. Referring to Figure 9, prior to 16:18:00 hours, the turbine operated at Core Idle conditions. In this condition no energy was produced, and the oil consumption at inlet of SOMS was low (point P1.4). Oil sampled at this point was one order of magnitude lower (i.e., 39.47 mg/m³) than oil collected at inlet at Full Load (i.e., turbine gas while producing energy). This result was consistent, because at Core Idle the turbine was not under “stress” and lower amount of oil consumption is expected. The point P1.13, P2.13 and P3.13 referring to outlet of the SOMS showed constant values. This was in keeping with one of the main goals of the system to maintain lower than 5 mg/m³ oil concentration at the outlet (i.e., we measured 2.11, 3.85 and 3.29 mg/m³) for the entire time when the gas turbine was in operation).
Results of the spectrometers and Dräger measurements at inlet and outlet of the SOMS are shown for Core Idle Phase and for Full Load, from Figure 10 up to Figure 16. For the results of the spectrometric measurements Figures 10,11,12 and 13, the graphs are the average of five samples at starting of Core Idle and Full Load conditions respectively.
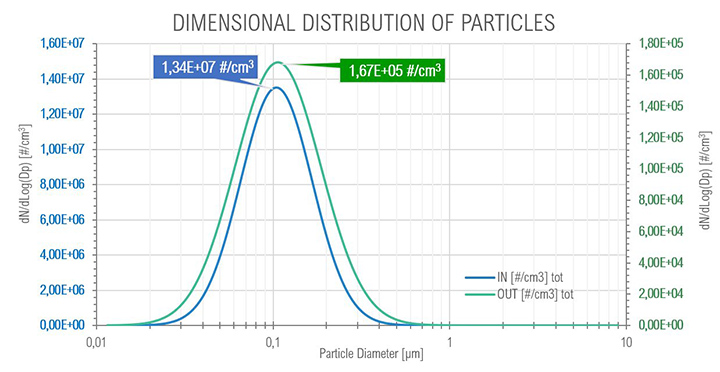
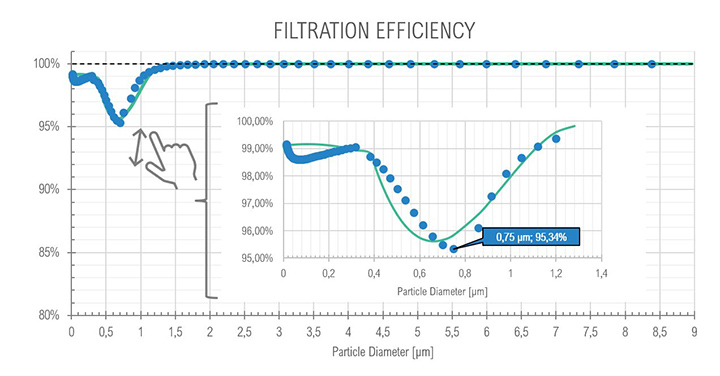
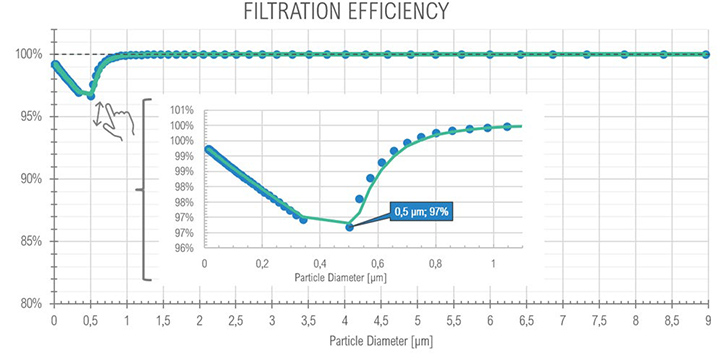
For the core idle phase as expected with the SOMS, the results show the particle reduction (and consequently the oil quantity) between points 6 and 13, at upstream and downstream the cartridges box respectively. The curves show a reduction of two order of magnitude, passing from an order of 1E+07 to 1E+05 numbers of particles per cm³, showing that coalescence reduced the total amount of oil in the air. The mode of diameter distribution seems to be constant. The efficiency showed a minimum with a diameter of particle equal to 0.75 μm: in the range between 0.3 μm and 1.0 μm particles observe a “hybrid” behavior (i.e., Brownian and Inertial motion of the particle and most penetration capability) that is similar to the expected efficiency in fibrous filters.
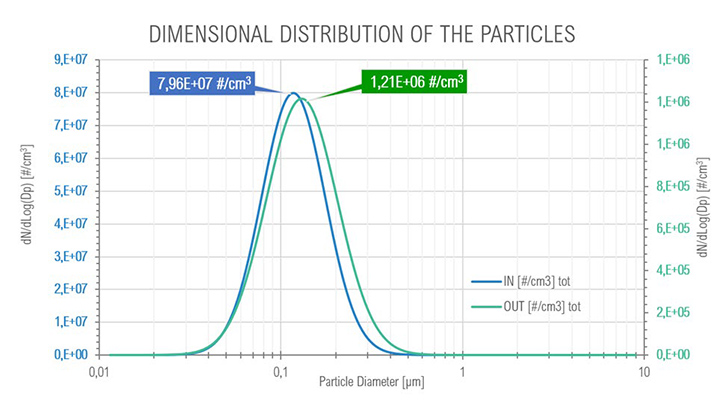
At full load conditions, it was possible to observe a transition (Figure 12) from smaller to bigger particles (the mode passed from 113 μm to 130 μm) after the coalescing cartridges in the SOMS, at outlet, due to coalescence phenomenon, from 7.96e+07 to 1.21e+06 #/cm³, that is expected to occur in the cartridges. Even at these conditions it was possible to observe a one order of magnitude reduction in the total amount of particle in the aerosol, from 7.96E+07 to 1.21E+06.
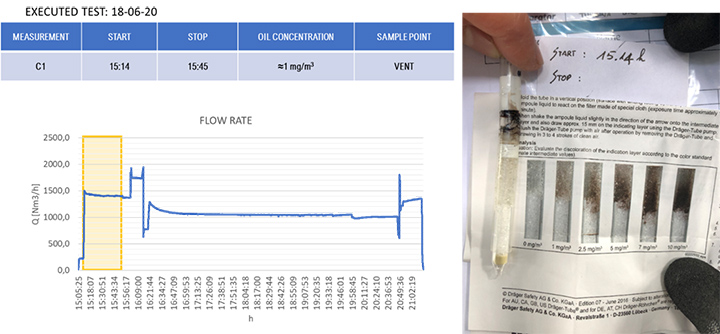
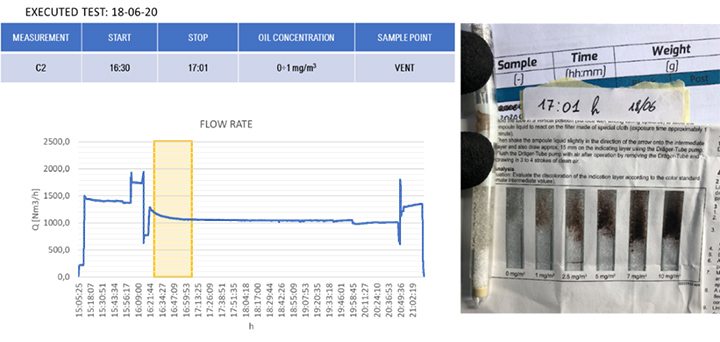
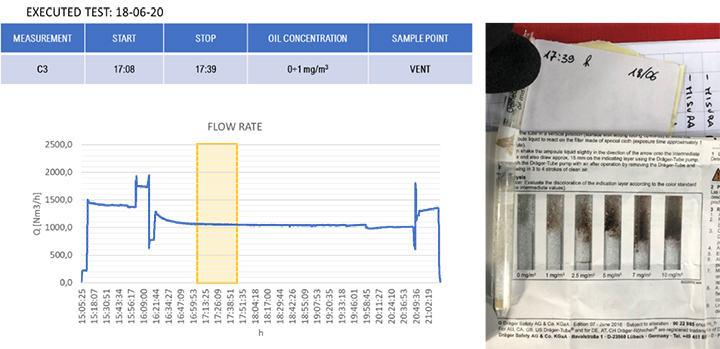
The efficiency estimated from the gravimetric analysis and the spectrometry was compared with the results from the Dräger sampling. Figures from 14 up to 16 show the results from the Dräger vials at different operational times. The Dräger measurements showed that the oil concentration was lower than 1 mg/m³ (from Figure 14 to Figure 16). This “visual” test was confirmed by Dräger; there was no reaction with sulfuric acid or no oxidation of hydrocarbons in the Dräger vials, demonstrated by the white vials. This confirmed that there was no oil present in the gaseous phase in gravimetric and spectrometer measurements. Dräger measurements confirmed the estimated high efficiency. The efficiency obtained from the other two measurements was higher than 99.0%.
The results of the gravimetric and Dräger measurements at the outlet of the SOMS (sampling point 13), Table 2, show that the oil concentration was below the required 5.0 mg/m³ emission limit. Considering the gravimetric measurements before SOMS between 16:19:12 and 16:48:00, that showed an oil concentration from 350 up to 650 mg/m³ (Figure 9); the results obtained at point 13 show the capability of the auxiliary system to reduce contaminants to acceptable values. The concentrations of 2.11, 3.85 and 3.29 mg/m³ at sampling times16:19, 16:48 and 17:45 respectively obtained by gravimetric measurements agreed with measurements by Dräger tubes – all measurements by Dräger tubes gave constant output of oil concentration lower than 1.0 mg/m³. Moreover, the efficiency of the SOMS by the different methods was comparable (99.27% – 99.37% of efficiency from gravimetric analysis up to 99.9% of efficiency from spectrometers). The difference in measured efficiencies can be explained because below 1.0 μm, filtration efficiency measured by the spectrometers (Figures 11 and 13) reduced to 95.34% and 97.00% respectively. Considering that with gravimetric measurements, it is not possible to measure by particle diameters, the lower efficiency values of 99.27% and 99.37% could be associated to the amount of particles having a diameter smaller than 1.0 micron that, as confirmed by spectrometers, were removed from the aerosol with a lower filtration efficiency. Finally, after 17:16:00, the gas turbine continued to produce energy for three more hours. It was possible to observe how the oil concentration reached steady state conditions. The gravimetric data were in agreement with spectrometers – both showed a significant reduction of oil content of two order of magnitude. This data confirmed the expected behavior of the entire system, in accordance with technical specifications and its design.
| Point | Time | Gravimetric | Dräger test | Spectrometer | |
| [-] | [hh:mm] | [mg/m3] | [%] | [mg/m3] | [%] |
| 13 | (Core Idle) 15:14 | – | – | < 1.0 | 99.9% (min 95.34) |
| (Full Load) 16:19 | 2.11 | 99.27 | – | 99.9% (min 97.00) | |
| 16:48 | 3.85 | 99.28 | – | ||
| 17:01 | – | – | < 1.0 | ||
| 17:39 | – | – | < 1.0 | ||
| 17:45 | 3.29 | 99.37 | – | ||
Table 2. Comparison between different analysis. The comparison was possible only at point 13 because the detection limit of Dräger. Efficiency of spectrometers saw minimum values in the range under 1.0 mm.
Conclusions
A standard approach shared by the scientific community to measure the actual emission from these turbines in situ is not currently available.
A procedure to characterize an auxiliary system like SOMS for the removal of oil mist in a gas turbine was developed and tested in the laboratory and in situ. The main goal of this paper was to fill the need for such a procedure since, from our experience, none are readily available. We were able to compare different measurement methods to suit the operational conditions of the turbine, which often causes problems during measurements of the performance of coalescing separators. This approach could be applied to other cases or auxiliary systems using similar coalescing separators.
In our work, the three measurement methods used – Gravimetric, Spectrometric, and Dräger – yielded results that were somewhat comparable. Using the three methods provide a redundancy in measurements and compensate for when in situ test conditions, such as temperature or concentration, are outside the measurement limits of any one of the methods.
Typically, results from spectrometric measurements were different compared to gravimetric analysis. With gravimetric analysis, all particles are collected without any information about the size of the particles. The lowest levels of efficiency observed for gravimetric analysis, < 99.8%, is a bit higher, but comparable to the 96-97% efficiency obtained with spectrometric measurements in the range between 0.3 and 0.75 μm (Figures 10 and 12).
The gravimetric analysis gave a representative measure of the performance of the SOMS. It showed an increase of oil quantity at inlet up to a stable value of 500 mg/m³, while the turbine was running. The same analysis permitted the monitoring of the outlet oil concentration, showing how well the SOMS was capable of maintaining a constant oil concentration at outlet of the turbine and within the emission limits (Figure 8).
Spectrometers have proven to be a reliable real-time measurement method for in situ measurements to understand the performance of devices like the SOMS. The results may be used to estimate overall SOMS efficiency.
All three measurement methods techniques together allowed us to evaluate how the separator that was designed worked. The experimental data showed that the efficiency was comparable with the design values for the SOMS. Data also confirmed the capability of SOMS systems (coupled with a cooler) to consistently reduce the amount of oil dispersed as aerosol, with an efficiency higher than 99.00%, employing fiber glass cartridges to carry out coalescence.
The results showed that the oil concentration at inlet of SOMS for an aeroderivative turbine gas was the same at Core Idle as at the outlet of the SOMS at Full Load of the turbine. This result was not unexpected. During the Core Idle turbine is not at operational conditions, no energy is produced and rotative parts of the turbine present a lower stress level and so, a lower oil consumption (Figure 2).
Finally, measurements with Dräger vials demonstrated their capability to confirm in a few minutes and on site, the emissions at the outlet of SOMS. This compares favorably to spectrometers collection of data that must be post-processed, and gravimetric sampling that needs laboratory equipment that is not always available on site (e.g. offshore platforms).
This experience showed the effectiveness of the approach as well as its limits. Future work will include working to improve each step of the procedures to reduce errors and increase reliability. In the future, gravimetric sampling may be useful for species identification techniques such as FTIR analysis. FTIR analyses have been used for similar measurements by others [8], and measurement procedures are available in ASTM D7678-11 [17], where FTIR is employed for oil detection in water. FTIR analysis may give two important pieces of information: the first one is a more precise indication about the total amount of oil collected; and, secondly, a confirmation about the nature of the oil sampled on the membrane. Software code to process spectrometric data in near real time will also be needed to permit real-time spectrometric monitoring of turbine and SOMS exhaust.
References
- P.W. Wilsey, J.H. Vincent, M.J. Bishop, L.M. Brosseau, I.A. Greaves “Exposure to Inhalable and Total Oil Mist Aerosol by Metal Machining Shop Workers”, Special Section – Metalworking Fluids, AHIA Journal, 1996.
- “General Methods for Sampling and Gravimetric Analysis of Respirable, Thoracic and Inhalable Aerosol”, Health and Safety Executive (HSE), MDHS14/4, Methods for the Determination of Hazardous Substances, 2014.
- Belden R.B. & Reddy W.J., “Lubrication Oil Reservoir Mist Elimination”, Air & Waste Management Association, 2012, 44:4, 441-451.
- Dufaus O., Augustin C., “Generation, Characterization and Ignition of Lube Oil Mists”, Conference Paper – Montreal -Turbo Expo, 2015.
- Reed H.C., “Oil Mist Eliminators Are an Excellent Upgrade to a Gas Turbine Package”, Conference: ASME Turboi Expo 2007: Power for Land, Sea, and Air, 2007.
- “Drager-Tubes & CMS-Handbook 16th edition” Soil, Water, and Air Investigations as well as Technical Gas Analysis, 2011, Lübeck.
- Baron P.A., “Factors Affecting Aerosol Sampling”, NIOSH Manual of Analytical Methods, 2003 .
- Galea K.S., Searl A., Sanchez-Jimenez A., Woldbaek T., Halgard K., Thorud S., Setinsvag K., Kruger K., Maccalman L., Cherrie J.W., Van Tongeren M., “Oil Mist and Vapour Concentrations from Drilling Fluids: Inter- and Intra-laboratory Comparison of Chemical Analysis”, Ann.Occup.Hyg., Vol. 56, No 1, 2012, pp. 61-69.
- Rader D.J., Marple V.A., “A study of the effects of an isokinetic sampling”, Aerosol Science and Technology, Vol.8, 1988, pp. 283-299.
- Wilcox J.D., “Isokinetic Flow and Sampling”, Journal of the Air Pollution Control Association, 5:4, 2012, pp. 226-245.
- Yang.Y, Telionis D., “Design and Testing of Instrumentation for multi-phase flow sampling and local void fraction measurement”, Computational Methods in Multiphase Flow VII, Vol 79, 2013.
- Raynor P.C., Volckens J. Leith D, “Modeling Evaporative Loss of Oil Mist Collected by Sampling Filters”, Applied Occupational and Environmental Hygiene, 15:1, 2010, 90-96, DOI: 10.1080/104732200301890.
- Zhang X.Q., McMurry P.H., “Theoretical Analysis of Evaporative Losses from Impactor and Filter Deposits”, Atmos Environ 21(8), 1987, 1779-1789.
- Baron P.A., “Calibration and Use of the Aerodynamic Particle Sizer (APS 3300)”, Aerosol Science and Technology, Vol.5, 1986, pp. 55-67 .
- Hinds W.C., “Aerosol Technology”, John Wiley & Sons, New York, 1982, pp.164-186.
- D’Arcy J.M., “Provisional Standard Test Method for Metal Removal Fluid Aerosol in Workplace Atmospheres”, American Society for Testing and Materials (ASTM), Method PS42-97, 1997, pp.1-6.
- ASTM D7678 – 11; Standard Test Method for Total Petroleum Hydrocarbons (TPH) in Water and Wastewater with Solvent Extraction using Mid-IR Laser Spectroscopy.


%20employed%20as%20an%20auxiliary%20system%20for%20an%20aeroderivative%20gas%20turbine)