There has been increasing interest in specifying the efficiency of ventilation filters at PM2.5 and PM10. PM is a statutory measure of outdoor air quality determined according to strictly specified procedures, or their approved equivalents. In this paper, an attempt is made to relate the measured differences to published theoretical comparison for single particles. The approach is extended to the measurement of filter efficiency for one sample. Further work is needed to confirm the results, and for a wider range of particle sizes and filter efficiencies.
Measuring particulate matter
PM 2.5 and PM10 are statutory measures for ambient suspended particulate matter. Determining concentrations of statutory pollutants requires one to adhere to prescribed methods and instruments. For PM, the prescribed method is based on the aerodynamic separation of the suspended particles into the 2.5 and 10 µm sizes, and gravimetrically determining the concentration of each fraction of sampled aerosol. In the United States, the devices for these measurements are exactly specified. The U.S. EPA has also approved alternate equivalent methods. While PM is a well-established measure of ambient air quality, no such regulatory measure exists for indoor air, or for measuring performance of ventilation products. Nevertheless, there is an increasing desire to quantify indoor air and air filters according to PM, but without the rigor of the prescribed measurement methods.
Filters are typically tested by measuring the concentrations of a challenge aerosol by an optical particle counter (OPC) up and downstream of the filter. OPCs measure the number concentration of particles in specific sizes from the intensity of light scattered by the particle. The particle size so determined are also termed the optical scattering diameter. This article presents an attempt to illustrate the differences between the OPC measurements and PM2.5 for an aerosol of cubic articles. Since KCl, the typical aerosol challenge used in determining the performance of general ventilation filters, can be assumed to be approximately cubic¹, the analyses can be extended to estimate the differences in efficiencies as measured and at PM.
For non-spherical particles, in addition to the density, one needs to account for the drag of the particle to determine the aerodynamic diameter. The coefficient of drag is typically measured experimentally.
Simple computations
The optical scattering diameter depends on the shape, optical properties, and the orientation of the particle in the sensing volume of the OPC. For example, a particle with strong light absorption properties, say carbon, will exhibit a relatively small scattering intensity, and hence will measured as a small particle by the OPC. Or an elongated particle, say a fiber, will have different scattering intensity depending on its orientation relative to the light beam. Hence, one considers the size measured by an OPC to be the equivalent optical scattering diameter as opposed to a physical size.
PM measurements requires the aerodynamic size of the particles. Aerodynamic diameter is defined as an equivalent unit density sphere that has the same settling velocity as the particle in question. This occurs when the drag force due to the settling velocity is in equilibrium with the gravitational force, given as:
V ∝ d² ρ
From this, if the aerodynamic diameter dpm, of a nonunit density sphere of diameter dp is:
dpm = dp x √ρ
For non-spherical particles, in addition to the density, one needs to account for the drag of the particle to determine the aerodynamic diameter. The coefficient of drag is typically measured experimentally. While it is well defined for spheres, for other shapes, in particle mechanics, it is usually accounted for by introducing a shape factor, xf, to account for the drag. The shape factor is the ratio of the drag of the particle in question to that of an equivalent volume sphere, i.e., a sphere having the same volume as the particle in question.
Then:
dpm = dp x √(ρ/xf)
As noted above, KCl is one of the preferred aerosol challenge for testing ventilation filters. KCl has a density of 1.98 gm/cc. There are indications that the KCl particles are approximately cubic1. The equivalent volume diameter of a cube is ~ 1.24. At low Reynolds Number, Re, the shape factor for a cube is reported to be 1.082,3,4. At these low velocities, the cube can also be assumed to naturally orient itself, possibly for the least drag.
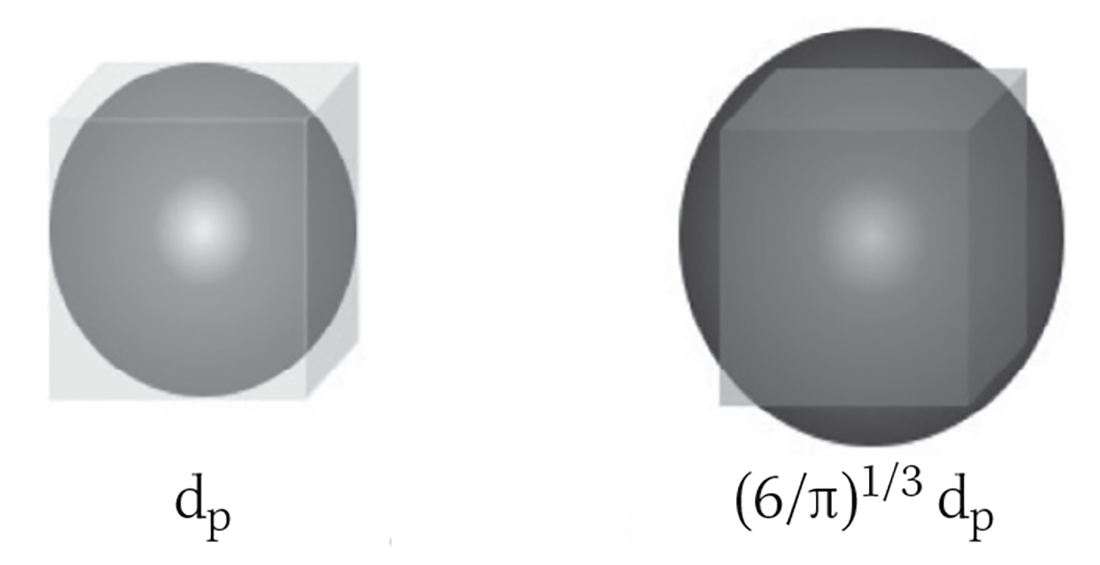
It is worth noting that the OPC measured optical scattering diameter is neither the equivalent volume diameter nor the linear dimension or the side of the cube. For this analysis, we reasonably assume that equivalent volume diameter will be between these two values:
1. It is the same as the optical scattering diameter, implying that the side of the cube is the same as the measured optical diameter, dp.
2. It is the diameter of a sphere with the same volume as a cube with its side the measured optical diameter, or equal to
(6/π)1/3 dp.
This is illustrated in Figure 1.
Accounting for these factors, we can compute the aerodynamic diameter of a cubic particle to be approximately between 1.35 and 1.51 times the OPC measured diameter.
The effect of this theoretical correction for aerodynamic size on the reported filter efficiency for one filter obtained from commercial marketing literature is shown in Figures 2. This data is tested with KCl aerosol and a particle counter. In this analysis, the optical properties of KCl particles are assumed to make them true optical scatterers, i.e., no scattered light intensity is lost.
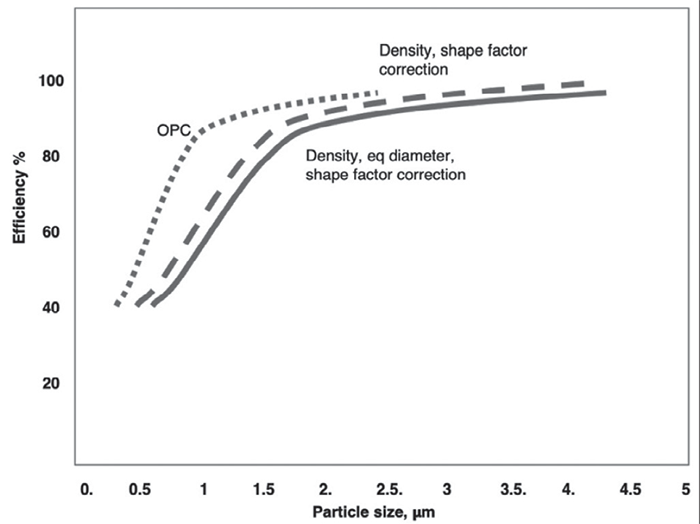
As seen in the Figure 2, the computed correction for PM shifts the filter efficiency to larger sizes, mainly due to the higher density of KCl and the larger volume equivalent diameter. That is, the reported OPC measured efficiency will be lower than at the numerically equivalent PM.
In this illustrative example, the efficiency at the estimated PM2.5 is about 7% lower than that measured at 2.5 µm as measured by the OPC. Similar comparison at PM10, not shown, indicates a smaller difference since at the larger sizes, the efficiency reported for this filter is nearly 100%, i.e., the efficiency curve is flat and remains close to 100% for all particle sizes beyond a certain size, and hence changing the diameter scale to PM does not affect the results that much.
| Mass concentration, mg/m3, | Gravimetric/OPC Ratios | |||
| Gravimetric | OPC Computed | By mass | By diameter | |
| 1 | 1.25 | 0.59 | 2.12 | 1.28 |
| 2 | 5.83 | 1.38 | 4.22 | 1.62 |
| 3 | 7.5 | 2.18 | 3.44 | 1.51 |
| 4 | 8.33 | 1.84 | 4.53 | 1.65 |
| 5 | 0.833 | 0.346 | 2.40 | 1.34 |
| 6 | 0.556 | 0.325 | 1.71 | 1.20 |
| 7 | 0.417 | 0.179 | 2.33 | 1.33 |
| 8 | 0.208 | 0.157 | 1.32 | 1.10 |
| Mean | 2.76 | 1.38 | ||
| Std Dev | 1.17 | 0.20 | ||
Table 1. Aerosol concentrations measured with a PM2.5 inlet.
Experiments
The experimental measurements were limited to PM2.5. In standard PM measurements, the ambient aerosol is first separated into the PM2.5 and PM10 fractions by the respective PM inlets and the concentration of aerosol is gravimetrically measured to determine the PM concentrations. In these experiments, the concentration of a KCl test aerosol was measured by an OPC as well as gravimetrically. Measurements by both methods were made with and without a PM2.5 inlet.
For the measurements we used the following instruments and devices:
1. A wide range single particle counter (WPS 1000XP, MSP Corp, USA), that operates as an OPC in the PM2.5 size range
2. A PM2.5 inlet (BGI PM2.5 impactor inlet at 4.0 LPM, BGI Corp, USA) to classify the aerosol aerodynamically.
3. Aerosol generator (TSI large particle generator, Model 8108)
4. A filter collector and membrane filter for gravimetric measurements
A dust monitor (Dustrak, Model 8532, TSI Inc., USA) was also used to monitor and verify the real time concentration of the test aerosol. During the experiment, the dust monitor indicated stable aerosol concentrations. This data is not shown.
It should be noted that the PM2.5 inlet used for the measurements is not strictly the same as the statutory inlet specified in the regulations. These inlets have large footprints and are designed for large air flowrates, making them unsuitable for use in laboratory measurements. Since the objective of this work is only a simple comparison of OPC and PM measurements, the commercial PM inlet used is sufficient to yield valid comparative data.
The measured cumulative size of KCl aerosols with different different concentrations are shown in Table 1. The gravimetric data is then the approximate PM concentration. Approximate since the inlet is not specified by the statute but does have a cut size of 2.5 µm.
In the data shown in Table 1, since mass is measured, for the purposes of comparing the diameters, the cube root of the mass ratio is used. Although the measured data are strictly not a diameter, the cube root is treated as parametric representation of cumulative PM mass, or as an equivalent cumulative diameter.
The differences in the measurements shown are expected due to the differences between the measurement techniques noted earlier. The mean diameter ratio for the aerosol is 1.38, with a relatively large standard deviation of 0.20. That is, the PM2.5 diameter is nearly 40% larger than that measured by the OPC. This is similar to the computed estimate of the difference between the two measurements noted earlier.
Summary of results
This work illustrates the differences in results between PM2.5 and OPC measurements of the KCl aerosol commonly used in filter testing. The cube root of the measured gravimetric data is treated as parametric representation of cumulative PM mass, or as an equivalent cumulative diameter. This equivalent PM2.5 diameter is nearly 40% larger than that measured by the OPC. This ratio seems consistent with theoretical expectations computed for single particles. Extending the analyses to filter efficiency shows that the efficiency as measured by a particle counter at 2.5 µm overestimates the efficiency at PM2.5 by approximately 7%.
Further measurements under more precise control of experimental variables will be required for a more definitive conclusion, including ascertaining the contributions of OPC efficiency, sample losses, optical properties of the aerosol, and other sources of experimental errors. Whether the OPC measured diameter is a measure of the volume equivalent diameter is also of interest. In the future, this work will be extended to investigating the efficiency of filters at PM2.5 and PM10 and its comparison to the common OPC based efficiency measurements.
References
1. SEM and Microscope data presented at ASHRAE 52.2 Committee, 2016-17
2. Willeke and Baron, Aerosol Measurement, Van Nostrand Reinhold, 1993
3. William C. Hinds, Aerosol Technology: Properties, Behavior, and Measurement of Airborne Particles, 2nd edition, John Wiley & Sons, 1998
4. Johnson, David L., David Leith, and Parker Reist, J Aerosol Sc, v18, no 1, 1987
![Figure 1: Heat Exchanger Proventics GMBH.[22]](https://www.filtnews.com/wp-content/uploads/IFN_2_2024_crimpedmicrofiberyarns_Fig.-1-Heat-exchanger-225x125.jpg)

