Porometry has been used extensively for more than 25 years to assess pore size distributions of nonwoven filter media and their relation to filtration performance (Refs. 1, 2). There is even an ASTM procedure (F316) that describes the maximum pore size (bubble point), as well as the pore size distribution by measuring air flow at various applied pressures (Ref. 3). The Mean Flow Pore (MFP) size was also detailed using this procedure. However, the procedure’s main drawback was that it was manual; thus labor-intensive, and somewhat dependent on the operator’s subjectivity.
Many investigators have extended this early work, but the greatest advances have been made through automation, which has eliminated the interference of the operator’s subjectivity (Refs. 4-8). As a result, most synthetic media manufacturers today use these instruments for research and quality control. However, many metal media manufacturers still use the outdated bubble-point procedure with isopropyl alcohol as the wetting fluid (ASTM E128), but with the advent of computer technology, the automated capillary porometers can now even measure open screens (Refs. 8-9).
Earlier researchers used traditional porometer technology, which is limited to media with micron ratings below about 100-micron and has some evaporation issues as well as other limitations (Refs. 5-6, 10-12). And upgraded versions never performed satisfactorily, and were later withdrawn from the market. The properties of a filter medium other than the obvious mechanical strength, thermal, and chemical are usually enumerated as the four or, sometimes, five filtration specific qualities (Refs. 14-15):
- The smallest particle the medium can retain at a specified efficiency (i.e., its so-called micron-rating)
- Its filtration efficiency at a particular particle size
- Its permeability or resistance to the flow of a clean fluid (usually air or water)
- Its dirt-holding capacity
- Its tendency to blind after repeated use (i.e., filter press cloths, backwash or back pulse socks, filter leave bags, etc.)
There have been many test procedures developed over the years which characterize these properties as well as detail the testing equipment and procedures (i.e., refer to ASTM, TAPPI, ISO, BSI, DIN, etc. for additional information and also Refs. 3, 12, 16). There are also many test labs now available to measure these properties for the end-user that does not want to invest in the various types of test equipment (i.e., FTI, IBR, IFTS, etc.).
Filter challenge testing has been extensively reported on in the literature (Refs. 15, 17, 18), and basically involves challenging the medium in a controlled manner with a dispersion and measuring its efficiency as a function of particle size throughout its typical life (i.e., 0-30 psid, for example). There are various challenge materials used as so-called “standards,” but basically, they determine properties (1), (2), and (4) listed above. Sometimes (i.e., Refs. 19, 20) these tests can be used to assess characteristics of property (5).
Porometry, on the other hand, can only measure the medium’s pore size distribution using a clean fluid, property (3). However, we can infer property (2) by various empirical techniques (i.e., Refs. 1, 2).
Many researchers have also correlated porometry parameters with actual filtration challenge tests (i.e., Refs. 7, 12, 19, 20). However, the size of the pores is only an approximation of the particle size that the medium can retain by straining. Porometry assumes ideal cylindrical pores (Refs. 13, 15), as per the early bubble-point test (Ref. 3). Yet there are few media in actual practice that have ideal cylindrical pores. Even the nuclear track-etched membranes by Nuclepore and Osmonics (Refs. 13, 21) can have overlapping pores, which reduces the number of true cylinders. Nonetheless, they are the closest to having true cylindrical pores of all available filters and are consequently widely used for analytical and calibration purposes.
Despite this flaw in its assumptions about true cylindrical pores, porometry has been widely used in industry. Together with rigorous challenge testing it remains one of the two most common methods for evaluating filter media.
Porometry – theoretical considerations
The basic equation that has been universally used is the LaPlace expression (Ref. 3): (1) dc = 4000 σcosθ/P
where dc = equivalent pore diameter, μm; σ = surface tension, mN/m; θ = contact angle (degrees) between the liquid and the pore; and P = pressure, Pa. This equation simplifies to:
(2) dc = 4000 σ/P
when the chosen fluid completely wets the material because cos (θ = 0) = 1. However, there have been many fluids chosen in the past that do not meet these criteria (i.e., see Ref. 22 for an excellent discussion of wetting fluids). Nevertheless, equation (2) has been extensively used to determine the equivalent pore diameter of filter media via the bubble-point test method (Ref. 3).
An excellent overview of nonwoven filtration mechanisms as well as a discussion of the four removal mechanisms can be found in Refs. 23 and 24. The discussion here, however, will be limited to direct or dead-ended filtration rather than cross-flow filtration, which has been extensively studied, particularly with respect to microporous membranes in the pharmaceutical and electronics industry, as well as particle size measurement. Furthermore, extensive bacteria, glass bead, latex, and AC Fine Test Dust (ACFTD) challenge testing has been conducted on various membranes of all types and a whole hierarchy of media performance ratings have been established. On the other hand, extension to nonuniform nonwovens has not been as successful primarily because of the highly varying pore structure, fiber diameter, fiber shape, etc. The best attempts at characterizing nonwovens, I have found, are the theoretical discussion in Refs. 1 and 2. The development in Ref. 2 is particularly useful since carefully controlled media were evaluated to corroborate the theoretical development.
The next step in this nonwoven filtration performance assessment is to correlate porometry parameters with actual filtration challenge tests (e.g., Refs. 5, 12, 17, 25-36). The first attempt of this was reported by Batchu, et al. (Ref. 5). However, only general comparisons were made relating to latex bead, ACFTD, and crushed quartz filtration efficiencies of 5 and 10-micron Nuclepore membranes to Coulter Porometer parameters. Mayer (Ref. 17, 19, 20, 25-27) extended this work for a variety of actual challenged applications with a variety of media.
However, extension to filter cartridges has been rather limited (i.e., Ref. 27), since flowrates are quite high through a typical 10” depth cartridge. This paper will present some new data for bag/cartridge media, and nonwovens; and will attempt to correlate efficiency measurements with porometry for open filter belt media, as well as calibration track-etched membranes (Ref. 21). It will also compare the simpler Whitehouse glass bead challenge test method (Refs. 31-36) with porometry values that were obtained on various porometers after they were calibrated and cross-validated. In addition, the steps taken over the past years to obtain consistent porometry results will be discussed.
Porometry validation with glass bead challenge testing
Original data:
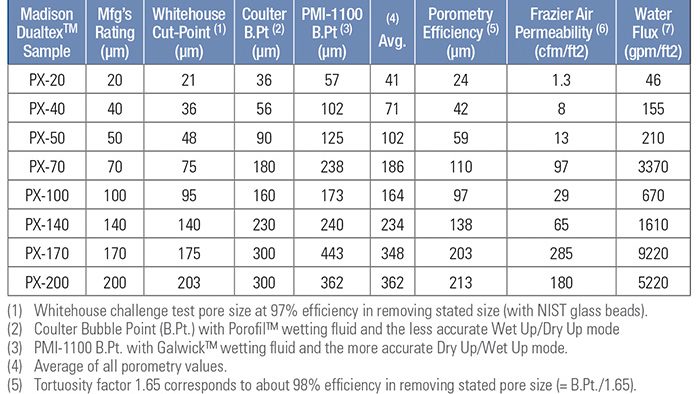
The first comparison of these methods (Refs. 31, 32, 36) showed some significant differences (Table I) where only two porometers were used (the old Coulter-I and the newer PMI-1100 unit, which used different wetting fluids and a general PMI calibration – the Coulter cannot be calibrated). Table I shows:
- Good comparison of the Whitehouse cut points at 97% efficiency with the manufacturer’s ratings
- Fairly good comparison of the porometry efficiencies [when corrected for the 1.65 (~1.65) tortuosity factor that converts the B.Pt. to a more relevant ~98% efficiency] except for PX-70 and PX-170.
- The PX-70 and PX-170 samples’ Frazier air and water permeabilities are unexpectedly high and may indicate sample variability (particularly since different sample pieces were used for the glass bead and porometer tests). It may also be possible that the PX-70 sample was mislabeled for the porometry tests (more on this later).
Thus, this early data demonstrated the validity of the Whitehouse Glass Bead Challenge method, but some discrepancies with the porometry method. One should also be aware that the Coulter B.Pts. are not accurate above about 100μm.
Later data:
Subsequently, these same samples were tested on other PMI porometers after these units were cross-validated with Nuclepore and Osmonics standard track-etched membranes, along with a well-defined 105μ square mesh cloth and PX-170. It should be pointed out that all PMI units were pre-calibrated and standardized per the following:
- The same Galwick wetting fluid (and the same amount)
- The exact same sample holder on all units
- The same operator
- The same samples on all units to eliminate media sample variability from lot-to- lot
- At least three measurements (but in many cases six) to reduce sample-to-sample variability
- The same machine default parameters on all porometers
Table II illustrates some of the key results and shows:
- Excellent comparisons (within the standard deviations) between all PMI porometers on all samples
- Only one outlier (375μm for PX-170 on the old PMI unit, which when repeated resulted in a more reasonable 326μm value). This also points out the problem with porometry measurements of these Dualtex™ media.
- Generally low Coulter-I B.Pts., which is to be expected since it uses Porofil™ wetting fluid which is prone to evaporation and the less accurate Wet Up/Dry Up mode of operation (Refs. 13, 25).
- Some significant variations between different lots of membranes and the 105μm square mesh cloth.
- Good repeat results on some of the samples, which were retested on the same porometer.
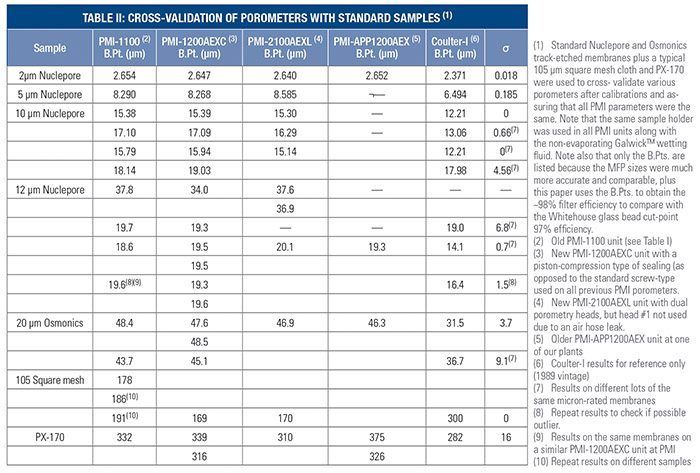
Thus, this extensive cross-validation study demonstrated that if all the required test conditions and parameters are carefully set, porometry results are reliable from all porometers (except perhaps for the old 1989 Coulter-I unit). It should be pointed out that the primary reason for doing this cross-validation was that none of the PMI porometers agreed with one another (primarily, of course because every plant ran theirs differently.)
Table III details the corrected Madison Dualtex B.Pts. from all porometers (18 measurements total) and shows:
- Good comparisons between porometry efficiencies and Whitehouse cut-point efficiencies except for PX-70, which suggests that a different PX-70 sample was tested by porometry (maybe even mislabeled?). It’s high air and water permeabilities (Tables I & II) as measured on the porometry samples suggests that something is amiss with this PX-70 sample.
- Good comparison of the PX-30 porometry efficiency and the cut-point efficiency obtained with the new Gilson sonic sifter (i.e., Ref. 31).
- Poor agreement of the Gilson test for another sample of PX-140 (119 vs. 140μm), but when this sample was cleaned and sent to Whitehouse UK, they obtained 116μm. Hence, media variability is prevalent with these woven dual-layer belts (e.g., see Ref. 32-34). This cross-check indicates reproducible results with two different Gilsons, different operators and two sets of beads. Furthermore, the difference between the original 140μm value and the 116μm retest by Whitehouse must be due to variation in the weave.
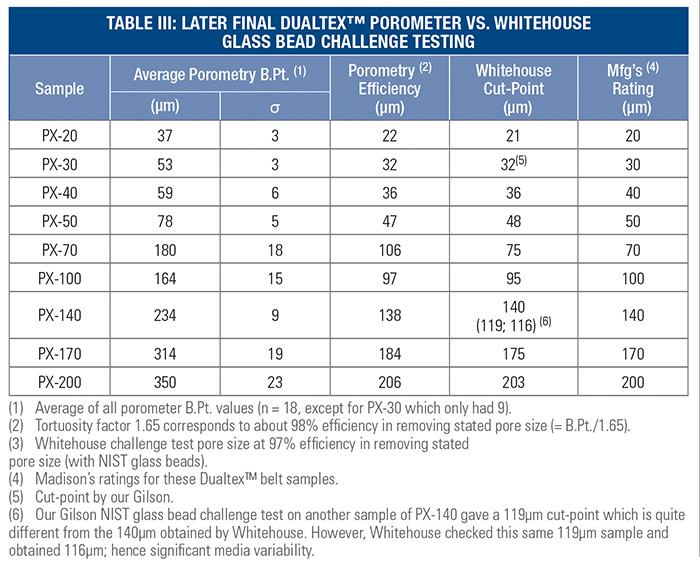
Thus, these final Madison Dualtex results demonstrated good porometry comparisons after all the porometers were calibrated and cross-validated (except for PX-70 which still is suspect based on its high air and water permeabilities); good comparison for the new PX-30 sample using the new Gilson sonic sifter; and reasonable comparison between these and Whitehouse sonic sifter results.
Porometry vs. Whitehouse glass bead challenge testing for needlefelts
Table IV details the porometry and Whitehouse glass bead challenge test results for various needled felts and shows:
- Excellent comparisons of porometry efficiencies with the manufacture’s ISO Coarse Test Dust (CTD) challenge ratings, but poor comparison to Whitehouse’s wet cut points (probably due to cake formation in these thick depth-type needled felts).
- Good comparisons for the thin Nomex felt.
- Very poor comparisons of the Whitehouse dry cut points for all felts probably due to bead capture inside these thick felts. Even our tests with multiple, long 5-minute siftings were lower than the porometry and ISO CTD challenge values, but significantly better than the Whitehouse values of < 17μm with only 1- minute sifting. This suggests that the dry sonic sifting method may not be suitable for these thick felts, and that a wet method is needed (i.e., Ref. 36 with modifications).
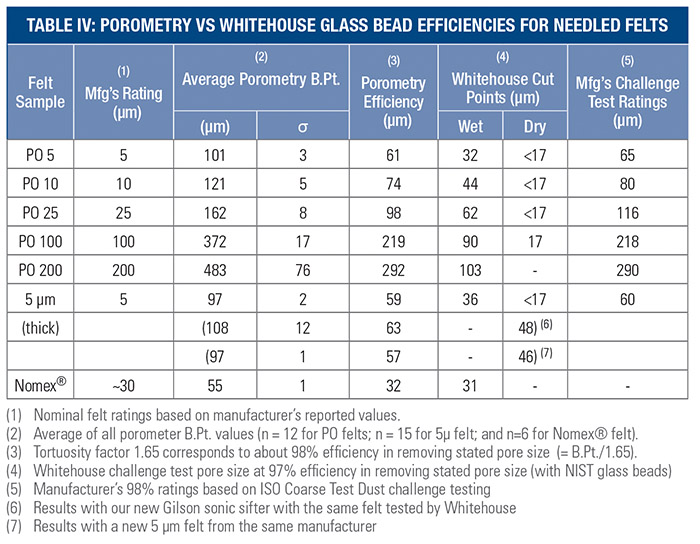
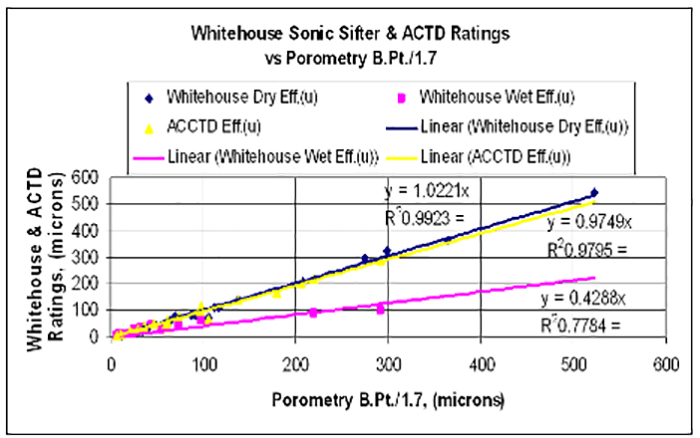
Thus, these felt tests demonstrated that porometry may be a better method than dry sonic-sifting; and the wet Whitehouse method requires more refinement (also refer to Figure 1).
Cross-validation against Whitehouse sonic sifters with porometry values for various media
Table V details the cross-validation of open meshes, etched sheets, and nonwovens by multiple porometers and two Gilson sonic sifters (Whitehouse and ours) using the same sifting conditions. Table V shows:
- Very good agreement between porometry efficiencies and Cut-Point efficiencies for all media.
- Very good agreement between the two Gilson sonic sifters (Whitehouse and ours) for all media.
- Good agreement for the highly variable nonwovens considering that different samples were tested by each method.
- Good agreement for the #644-07 (166μm) etched sheet if a 1.0 tortuosity factor is applied, which is acceptable based on the LaPlace equation for cylindrical holes. The reason that the cylindrical-holed Nuclepore and Osmonics track-etched membranes require the normal 1.65 tortuosity factor is that they have many doublet and triplet holes that connect to one another.
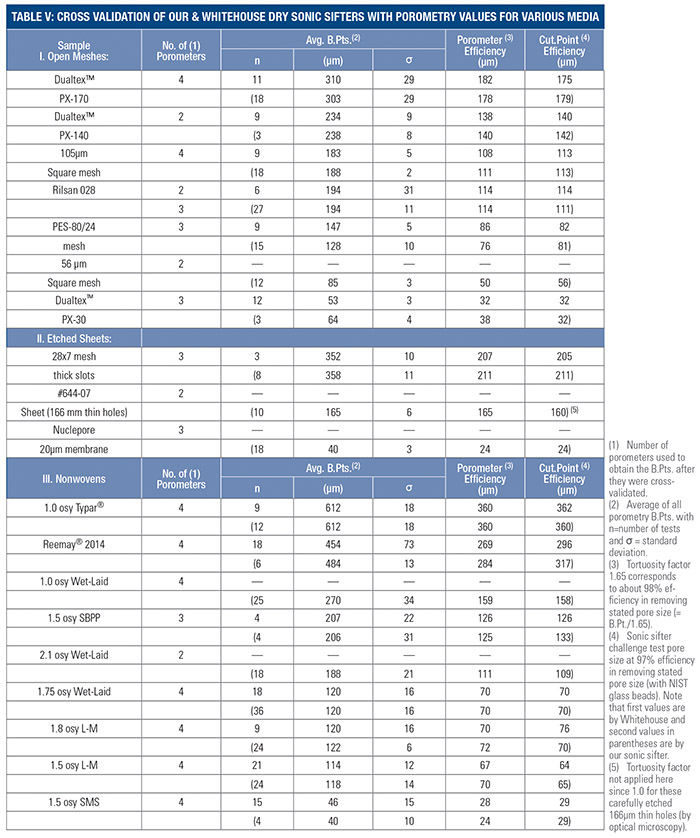
Thus, these cross-validation tests with the two Gilson sonic sifters evaluated here demonstrated excellent comparisons to each other despite different samples being used; that a 1.0 tortuosity factor is needed for etched cylindrical holes; and that porometry results in reasonable efficiencies compared to Whitehouse sonic softer cut-points provided the porometers are properly calibrated and cross-validated.
Pore size measurement by the indirect method of porometry can produce varying results dependent on the operator, the sample holder, the type of porometer (and its set up parameters), and, of course, the wetting fluid. However, consistent results can be obtained provided the same wetting fluid is used with the same sample holder and all porometers are properly calibrated and cross-validated (and of course, no leakage). As a result, porometry bubble point values can be correlated quite well via a tortuosity factor with the more accurate Whitehouse Sonic Sifter cut-point 97% efficiency with NIST-certified glass beads. This Whitehouse/Gilson Sonic Sifter method is reasonably accurate for most media, except, for thick needledfelts and is much easier to use than the elaborate ISO Fine and Coarse Test Dust (previously ACFTD & ACCTD) challenge procedures.
Acknowledgement
The author is very grateful to Dr. Graham Rideal of Whitehouse Scientific, LTD for his valuable assistance in all aspects of this project.
References
- Homonoff, E. C., La Francis, I. E., and Rodman, C. A. 12th Tech Symp of INDA (May 23, 1984); “Characterization and Effect of Pore Size Distribution on the Filtration Performance of Nonwoven Fibrous Webs.”
- Hoffman, C. S., INDA Filtration Workshop, (November 1983): “An Empirical Model for the Design of Fibrous Filter Media.”
- ASTM Procedure F316-80: “Pore Size Characteristics of Membrane Filters for Use with Aerospace Fluids,” October 31, 1980, and previous edition F316-70 (1970): “Standard Practice of Calculating the Average Circular-Capillary Pore Diameter in Filter Media from Measurements of Porosity and Permeability”; and E1294-89 “Standard Test Method for Pore Size Characteristics of Membrane Filters Using Automated Liquid Porosimeter.”
- Rodman, C. A., Nonwovens Research, 2 (1), 49-50 (1990): “Notes on Nonwoven Media Filtration Characteristics.”
- Batchu, H., Harfield, J. G., and Wenman, R. A., Fluid/Particle Separation J., 2 (1), 5-10 (1989): “A Comparison of Filtration Performance Using Particle Counting and Pore Sizing Techniques.”
- The Hershey Conference on “The Pore,” American Filtration Society, (May 22-23, 1991).
- Webber, R. V., Filtration News, 12 (2), 34, 38, 55 (March/April 1994): “Pore Analysis: A Key Factor in Filter Evaluation.”
- Porous Materials, Inc. (PMI) Bulletin: “The Best Selection for Your Filter Characterization: Capillary Flow Porometer.”
- Porous Materials, Inc. (PMI) Short Course Notes, Ithaca, NY (Oct. 2001).
- DeBruyne, R., in Advances in Filtration & Separation Technology, Vol 7, W. Leung, ed., American Filtration Society, pp. 91-101 (1993): “Recent Developments of Metal Fiber Filter Media in Fine Gas and Polymer Filtration.”
- Li, T., Fluid/Particle Separation J., 11 (1), 11-15 (1998).
- Johnston, P. R., Journal of Testing & Evaluation, 13 (4), 308-315 (1985): “Fluid Filter Media: Measuring the Average Pore Size and the Pore Size Distribution, and the Correlation with Results of Filtration Tests.”
- Mayer, E., Paper presented at 1999 Chem Show, New York City, NY, (Nov. 17, 1999): “Porometry Measurements – Past, Present, and Future.”
- Mayer, E., and Lim, H. S., Fluid/Particle Separation J., 2 (1), 17-21 (March 1989): “Tyvek® for Microfiltration Media.”
- Purchas, D. B., “Handbook of filter Media”, Elsevier Science, Ltd., Oxford OX51GB, England (1998).
- SAE Aerospace Recommended Practice ARP901, (March 1, 1988).
- Mayer, E., Fluid/Particle Separation J., 6 (2), 58-63 (1993): “Actual Challenge Testing versus Micron-Rating and Coulter Porometer™ Values.”
- Hong, I. T., and Fitch, E. C., SAE Technical Paper Series 851590, 1985, International Off-Highway & Powerplant Congress and Expo, Milwaukee, WI (Sept. 9-12, 1985): “An Innovative Technique in Filter Rating.”
- Mayer, E., Paper presented at 9th World Filtration Congress (WFC9), New Orleans, LA, (April 18-22, 2004): “Filter Cloth Blinding/Cake Release Assessment via Porometry Measurements.”
- Mayer, E., Paper presented at AFSS 11th Annual Conference & Expo, St. Louis, MO (May 4-7, 1998) : “Assessing Media Blinding/Cleaning via Coulter Porometer™ Analyses.”
- Mayer, E., and Wood, J. G., Paper presented at 10th AFSS Annual Conf. & Expo, Minneapolis, MN (April 29-May 2, 1997): “Track-Etched Membranes as a Filtration Analytical Tool.”
- Gupta, K., and Jena, A. K., Paper presented at 12th AFSS Annual Conf. & Expo, Boston, MA (April 6-9, 1999): “Substitution of Alcohol in Porometers for Bubble Point Determination.”
- Sandstedt, H. N., and Weisenberger, J. J., Filtration & Separation, (March/April, 1985): “Cartridge Filter Performance and Micron Rating.”
- Sandstedt, H. N., Nonwovens Industry, 40-44 (Feb. 1990): “Spunbondeds as Filter Media.”
- Mayer, E., Filtration News, 20 (5), 12, 14, 16, 18, 20, 22, 24 (Sept./Oct. 2002): “Porometry Characterization of Filter Media.”
- Mayer, E., Fluid/Particle Separation J., 14 (3), 203-212 (2002): “Porometry Measurement of Air Filtration Media.”
- Mayer, E., Paper presented at AFSS Topical Conf. – Filter Testing Processes & Equipment, Ann Arbor, MI, (Sept. 19-22, 2005): “Estimating Filter Media Filtration Efficiency via Porometry Measurements.”
- Choi, K., in Advances in Filtration & Separation Technology, W. Leung, ed. AFSS Proceedings, Vol 7, pp. 115-118 (1993): “Pore Size and Permeability of Cellulosic Filtration Media.”
- Choi, K., Cecala, D. M., and Yarbrough, D. W., Fluid/Particle Separation J., 5 (1), 10-13 (1992).
- Petri, H. R., Kesinger, T., and Lifshutz, N., Paper presented at AFSS 18th Annual Conf. & Expo, Atlanta, GA (April 11-14, 2005): “Comparison of High Performance Fuel Filter Media.”
- Rideal, G., Mayer, E., and Lydon, R., Filtration, 4 (1), 29-33 (2004): “Comparative Methods for the Pore Size Calibration of Filter Media.”
- Rideal, G., Filtration News, 22 (4), 8, 10, 12, 14 (July/August 2004): “Filter Pore Size Measurement: A Practical Approach.”
- Rideal, G., Filtration News, 23 (4), 8, 10, 12, 14 (July/August 2005): “Measuring Filter Performance by Challenge Testing, Part 1: Particles and Apparatus.”
- Rideal, G., Filtration News, 23 (5), 8, 10, 12, 14-15 (Sept/Oct. 2005): “Measuring Filter Performance by Challenge Testing, Part 2: Pore Size Information.”
- Rideal, G., Filtration & Separation, (5), 28-30 (May 2007): “Questions on Filter Pore Size Analysis.”
- Rideal, G., Filtration, 7 (2), 132-137 (2007): “Physical Measurement of Pores by Glass Bead Challenge Testing.”


