Airflow and filtration are the main two factors to IAQ, but how do you verify their effectiveness?
Air filtration, mainly particle filtration, is a hot topic for everything related to COVID-19 and protection from it, whether in the form of a face mask or through an indoor air quality (IAQ) solution. While filters and their efficiency are critical to achieving desired air quality in indoor spaces, they are only one part of the solution. Arguably, air flow is perhaps equally important for achieving the desired air quality. In some instances, a higher air flow through a lower efficiency filter has been noted to result in better outcomes than simply using higher efficiency filters, perhaps because of superior “scavenging” at the higher air flow rates. Regardless of the filter or air flow, without verification of the outcome, one’s claims may be just as good as another’s. Hence it is important to filter but verify.
Measurements
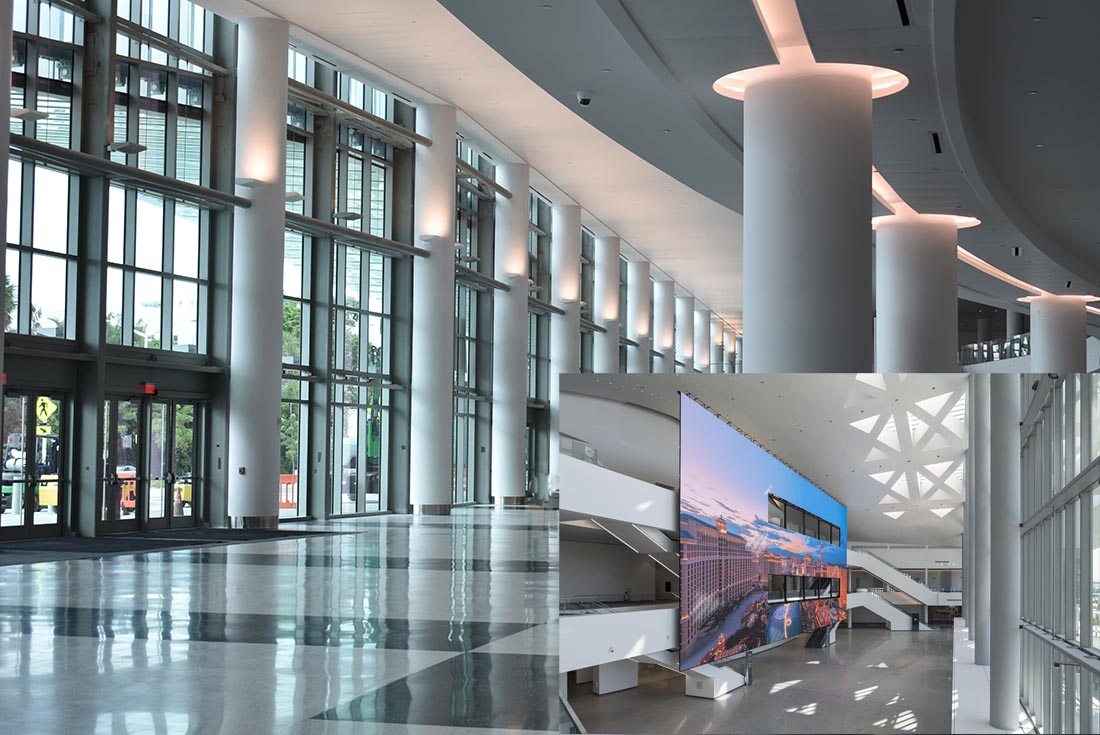
The American Heating and Refrigeration (AHR) expo held in the first week of February at the Las Vegas Convention Center, and the FiltXPO in the last week of March at the Miami Convention Center afforded an opportunity to verify air quality in large public facilities. Recognizing that air quality is more than just airborne particles, CO2 and temperature were also monitored in real time. CO2 is generally used as a measure of fresh air in the indoor space while temperature is a good measure of thermal comfort. It should be noted that until recently, systems as well as guidelines for general ventilation in buildings were designed for thermal comfort and not so much for particle or other pollutant limits.
The AHR is a large expo with over 50,000 attendees and over 1.5MM sq. ft. of floor space. FiltXPO is a smaller expo with about 5000 attendees and 450,000 sq. ft. of exhibit floor space. In both locations there was significant open space for no exhibit use. In terms of occupancy, one generally sees about two thirds of the attendees on the floor at any given time. Both convention centers were expected to have the usual well-designed and operated HVAC systems. In both locations, air quality sensors (Duet, TelosAir) were located in the TelosAir booth. In addition, at the FiltXPO, one each of the sensors were located in two other exhibitors’ booths (Hollingsworth and Vose and Blue Heaven)
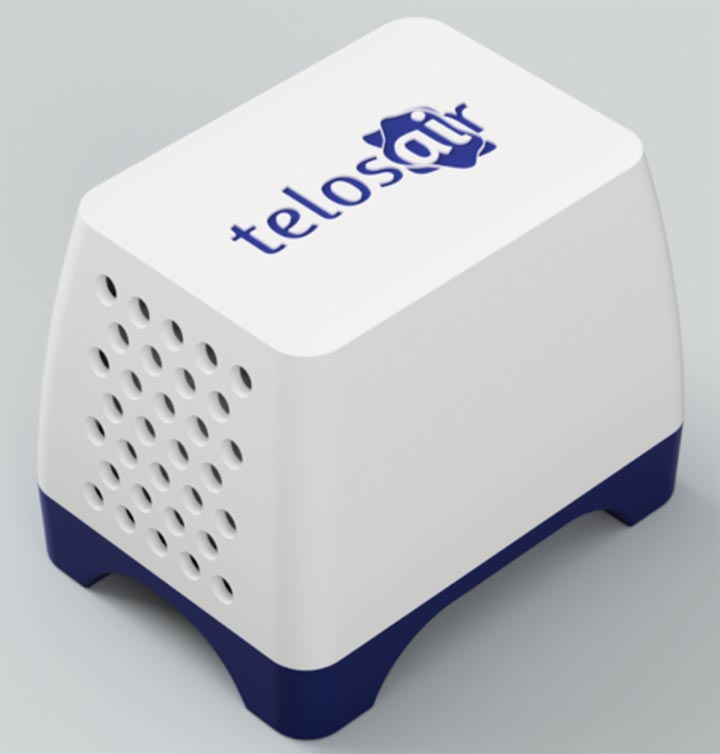
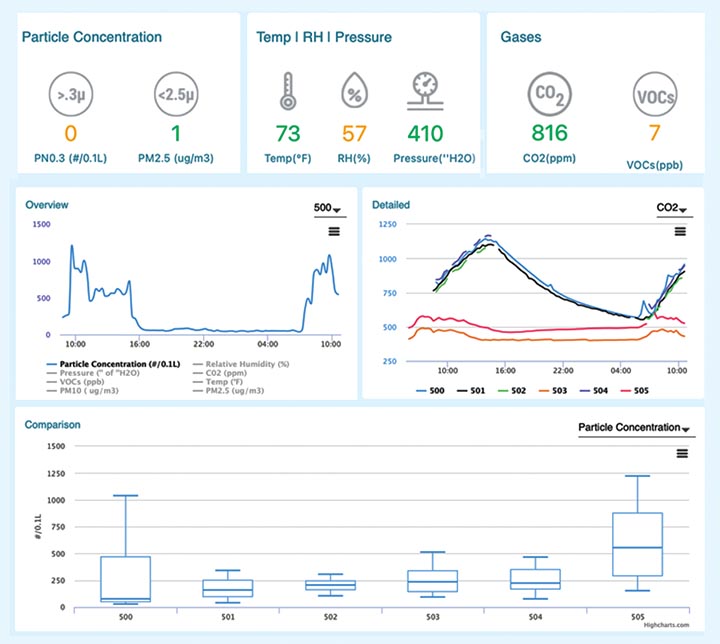
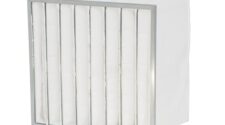
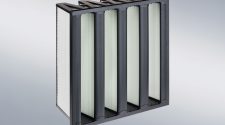
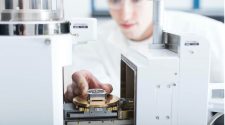
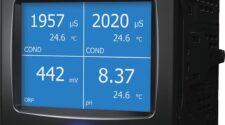
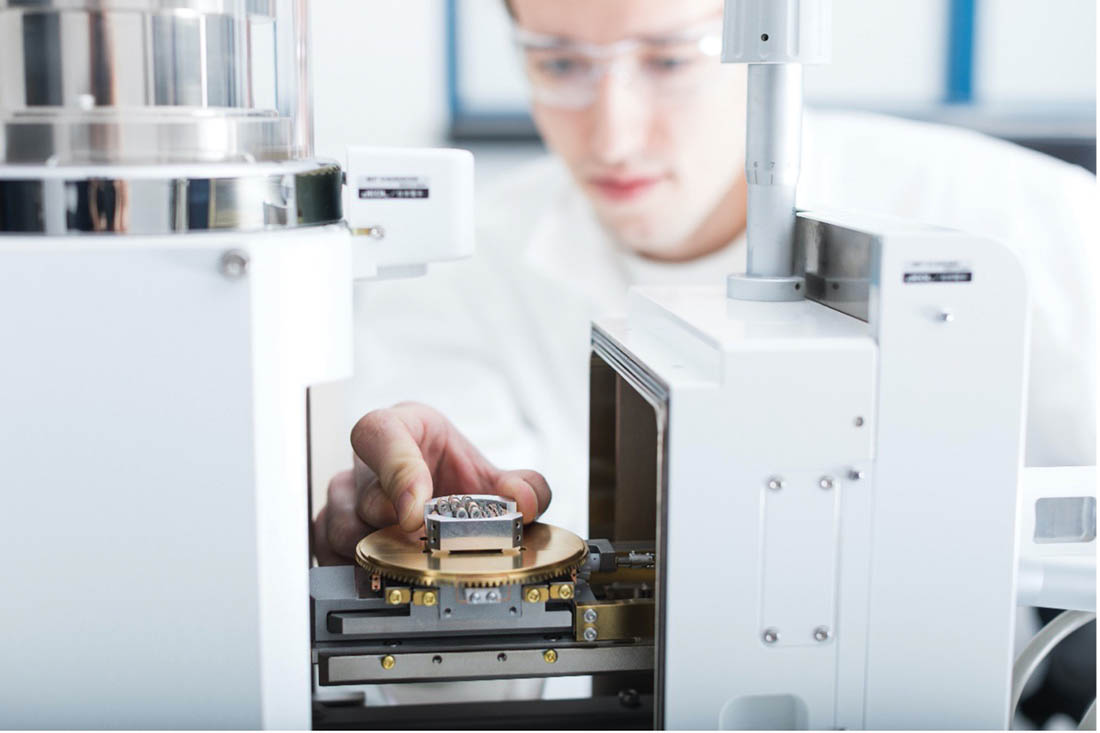
The Duet sensors used in this study (Figure 1) measure critical parameters that define the quality of our indoor air – particle concentrations (number and mass), CO2, VOCs, temperature, RH, and pressure. The Duet sensors are radio mesh-networked allowing for their easy deployment in outdoor areas or vast indoor locations such as convention halls. The data from the sensors is transmitted to a central gateway via the cloud. This arrangement allowed for real-time collection and display of the data in a live dashboard (Figure 2).
Without verification of the outcome, one’s claims may be just as good as another’s. Hence it is important to filter but verify.
Data
The deployment of the sensors allowed us to monitor air quality in the two convention centers and compare them. Firstly, it must be recognized that, traditionally, control of air properties has primarily meant maintaining a comfortable temperature. The secondary goal has been to control humidity. As seen in Figure 3, the temperatures in the two convention spaces were reasonably tightly controlled, suggesting that their air conditioning systems have been designed reasonably well for the large numbers of people attending the expos. A closer look at the temperature data provides some interesting insights. Both of the convention halls experienced an increase in temperature with the arrival of attendees. This temperature increase triggered the air conditioning system to maintain temperature in the two places at ~22-23 C. A minor difference in the temperature trends of the two halls is the fluctuations in the temperature in the Las Vegas Convention Center.
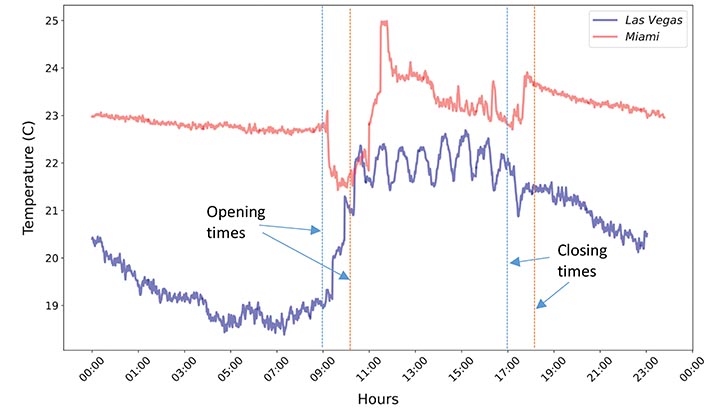
The differences in the air properties of the two convention halls is more apparent when their CO2 values are compared (Figure 4). Humans are the primary source for emission of CO2 in indoor spaces such as convention halls. The CO2 concentrations in both halls increased as exhibitors and attendees started trickling in just after the opening times. The difference in the CO2 trends of the two spaces is during the operating hours of the convention hall. The CO2 concentrations in Miami rose throughout the day until the convention closed while in Las Vegas it increased sharply in the first hour and then declined throughout the day. The average occupancy per sq. ft. is expected to be higher in Las Vegas due to the relatively larger attendance, suggesting that this decline is not because there were fewer individuals in the indoor space. Considering the fluctuations in the temperature seen around the same times in Las Vegas, it can be concluded that temperature control in Las Vegas is based on bringing in more fresh air from outside (possibly because February is a cool time in Las Vegas), resulting in a co-benefit of better CO2 control inside.
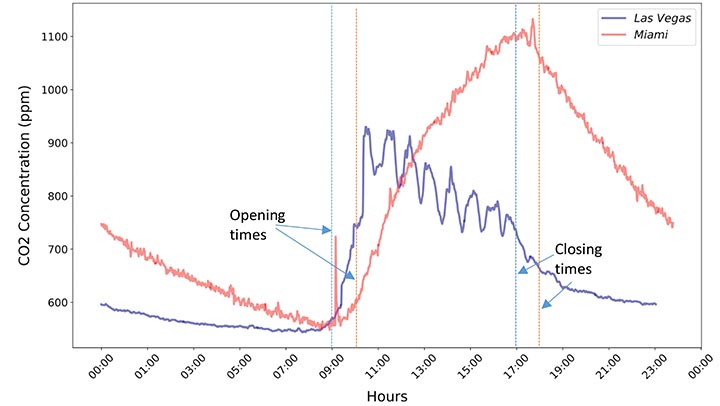
After the closing time, both halls saw a decline in CO2, consistent with evacuation of the spaces by people. From the CO2 decay, an effective air exchange rate can be calculated. We estimate the air exchange to be around 0.61 per hour for Las Vegas and 0.41 for Miami. It must be noted that the air exchange based on the flowrate of air passed through the ventilation ducts into the rooms is likely to be much higher, but the effective air exchange rate based on CO2 decay captures the fresh air input to the spaces.
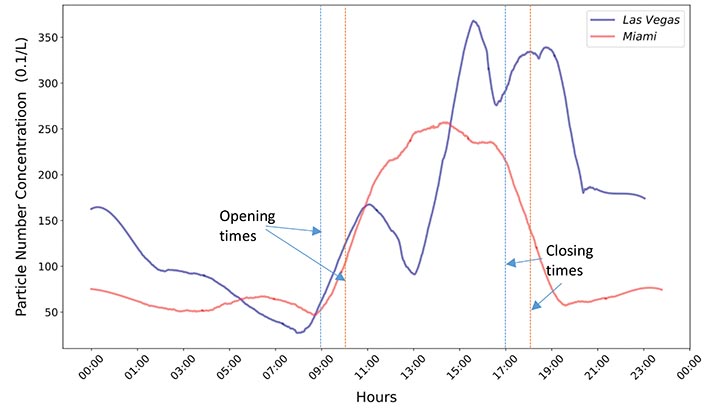
The final picture of the air quality story is from the trends in the concentration of airborne particles in the two locations (Figure 5). The particle concentrations measured by TelosAir Duets correspond to particles in the size range of 0.3 to 10 µm. Soon after the opening time, the influx of people into the halls result in an increase of the particle concentrations in both halls. This increase is because of resuspension of particles from the floor as people walk around and from human emissions.
Bringing in more outdoor air can reduce CO2 concentration and minimize the buildup of human emitted particles but will increase the contribution of outdoor pollution to the indoor space.
In Miami, the concentrations have a clear trend, with an initial increase for the first four hours and then the concentrations are nearly steady until 5:00 pm – suggesting some filtration in the supply/return line of the ventilation system. As people leave the hall at the end of the day, there is a sharp decrease in the concentrations. In Las Vegas the trends are less obvious. This is because, if a significant fraction of the air introduced is outdoor air, then the outdoor particle trends can overwhelm the human-generated indoor particle trends.
The increase in CO2 and particle concentrations in the convention halls during the expos, particularly in Miami, suggests an increase in risk to the transmission of airborne disease in these indoor spaces. Bringing in more outdoor air can reduce CO2 concentration and minimize the buildup of human emitted particles but will increase the contribution of outdoor pollution to the indoor space. To reduce risk of exposure to indoor or outdoor generated particles, facilities managers should ensure that their ventilation systems have appropriate filters in place in the supply, return, and outdoor air ducts.
Summary
Traditional management of indoor air has largely focused on controlling the air temperature and humidity in a selected space. With recent focus on mitigating transmission of airborne diseases such as COVID-19, there has been a concern about the buildup of human emissions in indoor spaces, leading to use of higher efficiency filters. Using air monitoring data in the two heavily trafficked convention halls, we demonstrate how traditional ventilation systems with typical levels of filtration may be inadequate to address our need for healthy air. In the post-COVID-19 world that we now inhabit, there is a need for sensor-driven, energy-efficient ventilation systems that can smartly navigate between in-line filtration and outdoor air intake to provide healthy air that is critical to confidently work and play in indoor spaces.
Acknowledgement: We thank Hollingsworth and Vose and Blue Heaven Technologies for allowing us to deploy our sensors in the expo booths in the Miami FiltXPO.


