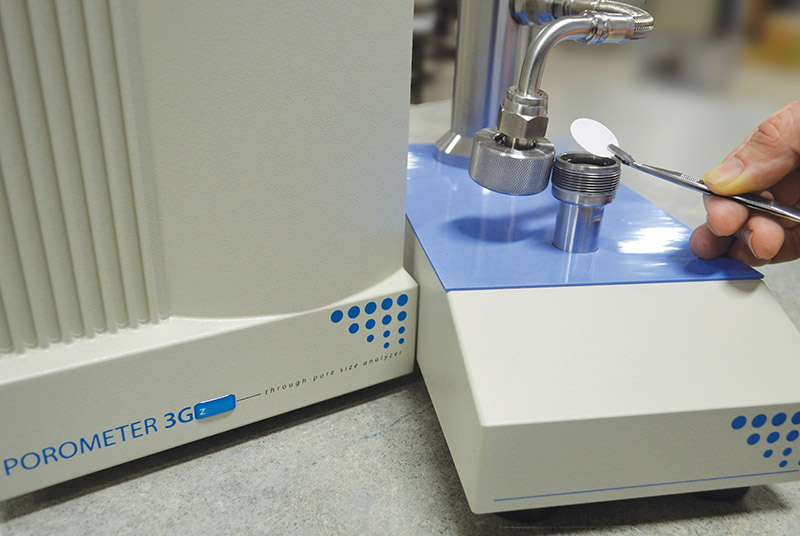
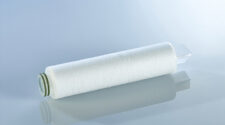
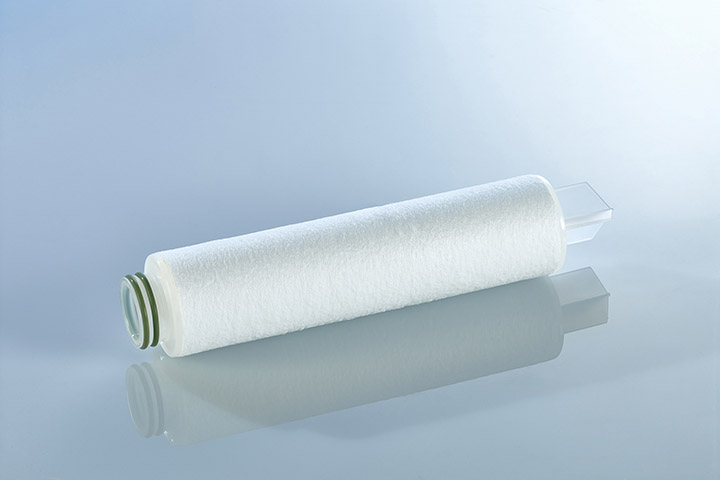
Capillary flow porometers are widely used for development and product control of filter media.
Due to their overall versatility of design and simplicity of operation, physical separations made by filtration media are becoming more and more attractive. Developing new materials for these applications requires ever evolving characterization techniques to best assess the properties of new and existing materials that equate to filter performance. In addition to defining the sizes of materials allowed to pass through the material, the through pore characteristics of a filter media affect operation parameters such as pressure drop and lifetime to regeneration or replacement.
Filter media & pores
In general, all filtration processes involve inserting a static structure into a dynamic fluid stream in order to separate out certain components from that stream. The actual separation is performed by the filtration media, or membrane, used within these filters. Understanding the size distribution of the pores that completely pass through the separating layer will define the sizes of particles, which can be transported through the filter, and those that are removed from the fluid stream.
Through pore characteristics, such as size distribution, shape and tortuous nature affect the pressure and flow reduction profiles associated with the use of the filter. The number of through pores of different sizes will also define the ultimate lifecycle of the membrane.
Pores, the empty structures contained within a material, can be separated into three categories. “Through Pores” extend completely from the upstream side to the downstream side allowing for flow through the material. “Blind Pores” are accessible from the exterior of the surface but do not extend completely to the opposite side. And “Closed Pores” are completely encapsulated within the material with no accessibility to the exterior surface. Through pores are responsible for the flow through the media and the separation process while the blind and closed pores contribute to structural properties of the media, such as strength, pliability, capacity, and mass.
Adjustment of the various size and volume characteristics of the pores present in filtration media allows the development and manufacture of materials with properties required for a wide range of applications. Measuring these characteristics allows prediction of the performance of the filtration media arising from these properties.
Measurement of through pores in filtration media
A number of methods are routinely used in the development and product control activities associated with the manufacture of filtration media. Microscopy provides a direct assessment of the pore structures present in the media, but each image is localized; therefore, obtaining a representative assessment of the entire material can be quite time consuming. Performance, or challenge, tests provide a direct assessment of the media performance but are also very labor and time intensive.
For some time now, both Bubble Point Tests and Capillary Flow Porometry have been used to assess the through pores present in filtration media. These techniques are based on a well-known relationship between a size of a pore and the associated pressure drop necessary to evacuate a wetted fluid from that pore. The Washburn Equation (based on the Young-Laplace Equation) defines the relationship between this pressure drop and the size of the capillary, or pore, as follows:
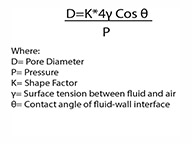
Knowing how the fluid wets the material, the surface tension of the fluid, and an estimate of the pore geometry provide the ability to correlate pressure and pore size. These techniques are simple, fast, and accurate assessments of through pores in filtration media, and therefore ideally suited for both research and product control purposes.
A Bubble Point Test involves covering a sample of filtration media with a fluid, classically water or isopropyl alcohol. An air stream is fed to the membrane from the opposite side and slowly pressurized. The pressure of the air stream is increased until the largest through pore present expels its fluid and allows air to flow through the membrane, which is observed in the fluid as an air bubble. The pressure at which this occurs is recorded as the “Bubble Point” and is then used to define the largest through pore size present in the sample with the use of the Washburn Equation, as mentioned above.
The size of the largest through pore defines the size of the largest particle, which will pass through the membrane. If 100% rejection of particles of a certain size and larger is required of the filtration media, this test will confirm whether or not the membrane will work for its stated purpose. This test is also useful in understanding whether or not there are unforeseen defects in the membrane.
This test has been used for product control purposes due to its speed and consistency in assessing the maximum pore size. In addition, automated instruments greatly reduce the amount of uncertainty in the measurement compared with manually operated versions. Unfortunately, the amount of information this simple test provides is fairly limited. In practice there are an infinite number of membrane pore structures with the same maximum pore size, which exhibit vastly different filtration performance and flow through characteristics. To understand how many through pores of different sizes are present in a filtration medium an assessment of the pore size distribution must be made.
Capillary Flow Porometry involves measuring both pressure and the amount of flow that passes through a sample over a range of pressures. These instruments also utilize the relationship between the pressure needed to expel a wetted fluid from a pore and the size of that pore as described by the Washburn Equation.
The measurement involves filling the pores within a sample with a fluid of known properties. Specifically, the fluid must be known to wet the surface of the sample and its surface tension must be known. This allows a simple relationship to be defined between pore size and the pressure drop associated with the expulsion of the fluid.
Once wetted, the sample is placed into the sample holder of the instrument in such a way as to ensure that the applied airflow will only travel through the sample. The capillary flow porometer then creates an increasing series of pressures upstream of the sample in a controlled fashion by opening an inlet flow valve. During this pressurization process the amount of flow through the sample will be measured. Initially, there will be no flow. Once the Bubble Point pressure is reached the largest pore(s) are emptied and an initial amount of flow will be measured.
The instrument then continues to increase the pressure and smaller and smaller pores empty as the capillary pressure associated with their emptying is reached. The resulting increases to the overall flow are then assigned to the appropriate pore sizes by relating the pressure at which they emptied to the size of the pores.
Once all of the pores have been emptied, the flow through characteristics measured will match those of a sample that was initially dried. This measurement is referred to as the “wet curve.”
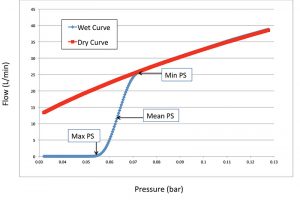
A typical analysis involves performing a second pressurization right after this first measurement. This time the sample is completely free of the wetting fluid during the measurement. The resulting curve is referred to as the “dry curve” – a measurement of the air permeability of the sample. See Figure 2 for a typical example.
The point on the wet curve in which the amount of flow is exactly 50% of the amount of flow seen on the dry curve at the same pressure defines the pressure associated with the mean pore size.
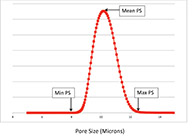
Using the data collected from these measurements, a plot of the cumulative percentage of flow versus pressure can be obtained. Converting these pressure values into pore sizes via the Washburn Equation and then taking the derivative of that curve provides a pore size distribution similar to that shown in Figure 1.
In addition to simply providing the value of the maximum pore size present, the overall through pore size distribution describes the number of pores of various sizes present in the filtration media. This knowledge allows the developer or manufacturer of the filtration media to better predict its overall performance characteristics.
It is important to remember that no direct information regarding the volume associated with the pores present in the filtration media is provided by this technique. This technique provides the only means to describe the limiting dimension of through pores. Other techniques, such as mercury intrusion, gas sorption, and gas pycnometry offer the ability to assess pore volume information, but are incapable of differentiating between through pores and blind pores in solid materials.
The speed and accuracy of bubble point tests and capillary flow porometry provide filtration media developers and manufacturers with valuable tools to measure the through pores present in their products. Understanding the characteristics of the through pores present in their products allows them to predict their ultimate performance.


